


Plan Snaplex capacity
Use the SnapGPT Assistant to forecast future CPU and memory demand for your Snaplexes based on historical usage trends.
Use the SnapGPT Plan Snaplex capacity skill on the Insights page in Monitor to analyze the historical CPU and memory usage across the selected Snaplexes and plan the required infrastructure changes based on the 12-month forecast report compared with the current capacity.

-
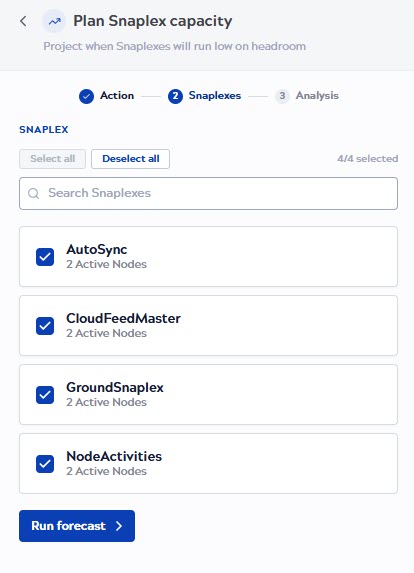
Select the Snaplexes to include in the forecast.
The wizard guides you through three steps: Action, Snaplexes, and Analysis. The Snaplexes step shows:
- A Select all and Deselect all control, with an indicator showing how many Snaplexes are currently selected.
- A Search Snaplexes field to filter the list by name.
- A checkbox list of Snaplexes, each showing the Snaplex name and active node count.
The Run forecast button is inactive until at least one Snaplex is selected.
-
Review the forecast results.
The analysis generates a forecast based on the aggregated usage of all the selected Snaplexes. The forecast report includes:
- Summary: An overview of the Snaplex's current resource state and projected capacity outlook.
- Expected growth: Projected annual growth rates for CPU and memory based on
historical trends. You can adjust the growth values by dragging the slider, and then
clicking Apply to regenerate the forecast based on the updated
values.

- CPU utilization: The line chart of the current and projected CPU usage over
time, plotted against the total available CPUs for the Snaplex. Two threshold lines
indicate the 80% and 90% utilization limits.
Data points beyond the current date are projections based on the selected growth rate. A label on the chart shows the current utilization percentage, the percentage and month and year when utilization peaked, and the percentage deviation from the historical trend. Hover over the solid or the dotted line to view the actual or the forecasted utilization percentage.

- Memory utilization: The line chart of the current and projected memory usage
over time, plotted against the total available memory for the Snaplex. Two threshold
lines indicate the 70% and 80% utilization limits.
Data points beyond the current date are projections based on the selected growth rate. A label on the chart shows the current utilization percentage, the percentage and the month and year when utilization peaked, and the percentage deviation from the historical trend. Hover over the solid or the dotted line to view the actual or the forecasted utilization percentage.
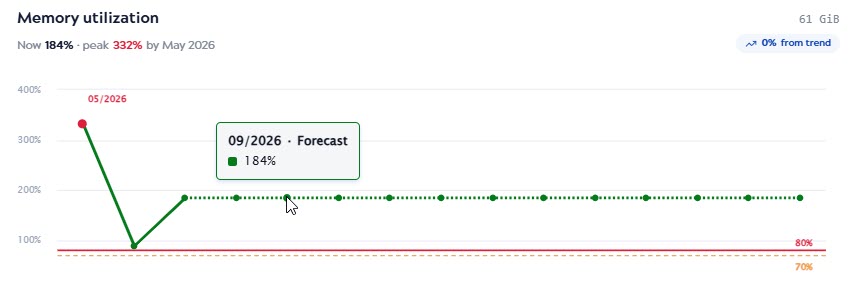
The SnapGPT Assistant produces a capacity forecast for each selected Snaplex, giving you visibility into projected resource demand so you can plan infrastructure changes ahead of time.