View node details
Each Snaplex node is a Snaplex service running on a host or VM. In the node map or list view, click a node to view its details. JCC nodes and FeedMaster nodes have a different header.
Execution node header
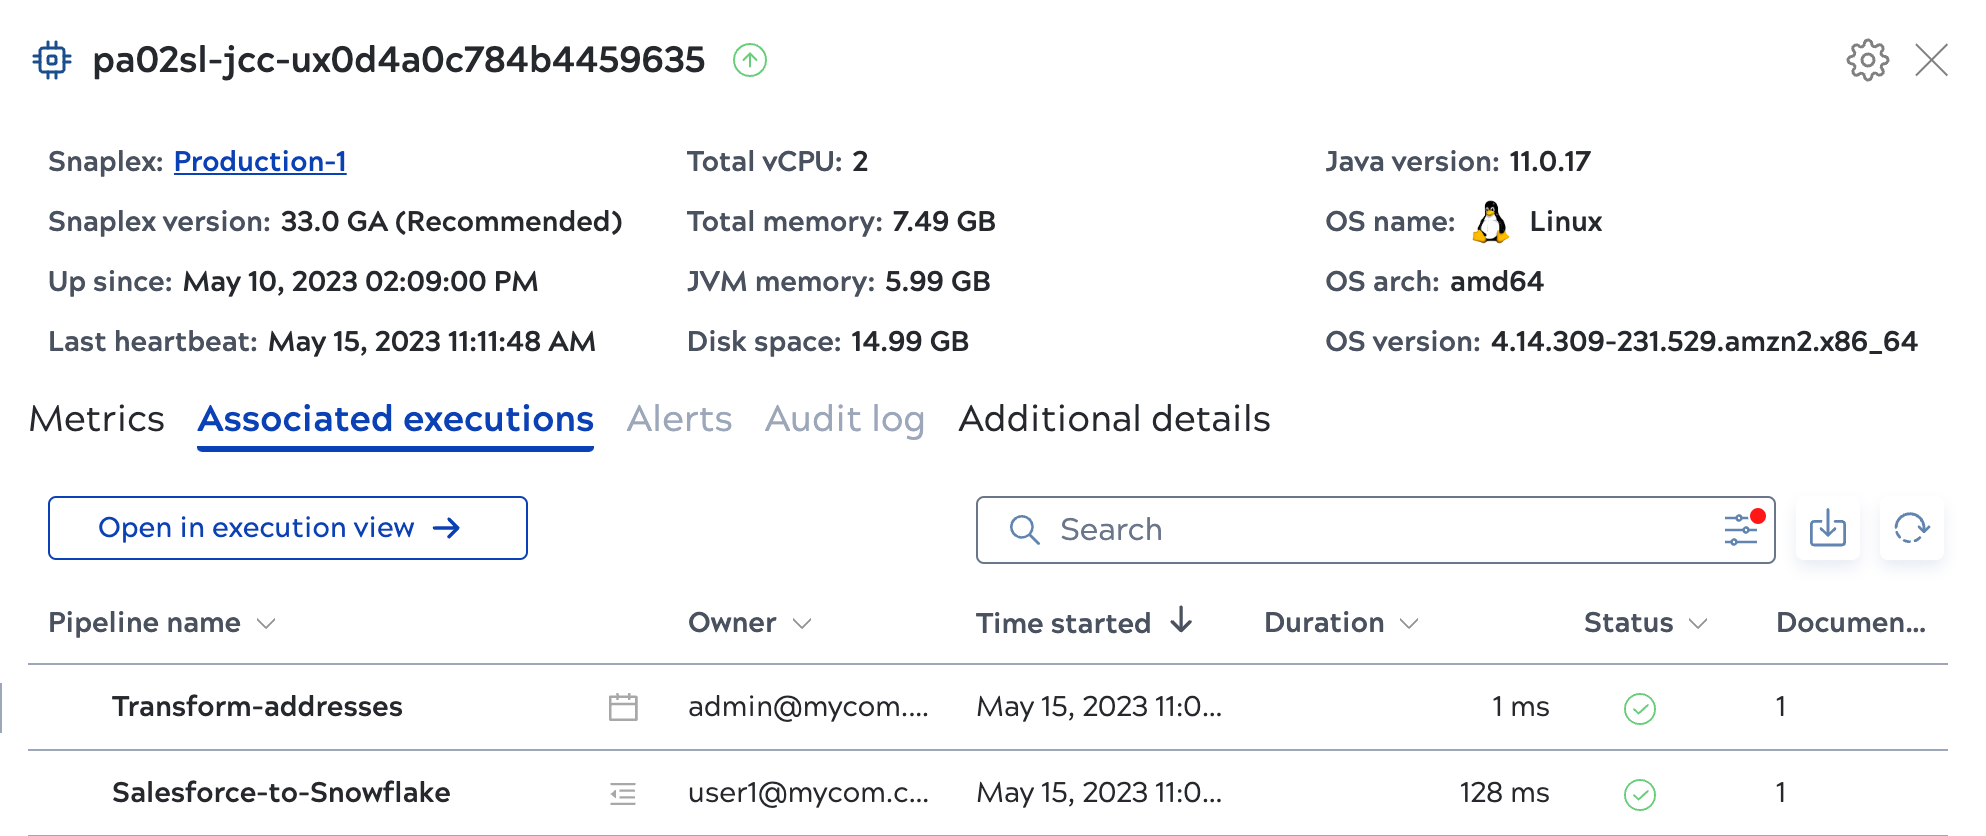
Node details include:
- The node name and status: The green arrow icon indicates the node is active.
- Snaplex: The parent Snaplex name. Click the name to open Snaplex details.
- Snaplex version: The parent Snaplex version.
- Up since: The date and time the node started.
- Last heartbeat: Nodes in a Snaplex send a heartbeat every 20 seconds to the Control Plane to indicate they're active. If the last heartbeat is not available or older than 15 minutes, the node is marked as inactive.
- Total vCPU: The number of CPUs on the virtual machine host.
- Total memory: The memory available on the host.
- JVM memory: The memory consumed by the JVM.
- Disk: The space for all mounts on the host and the percentage
currently in use.
- home: Disk space usage on the home directory.
- tmp: Disk space usage on the temp folder.
- Java version: The version of Java running the node.
- OS name: The OS of the host.
- OS arch: The chip architecture of the host.
- OS version: The host OS version.
FeedMaster nodes header
The details panel for FeedMaster nodes contains the following information:
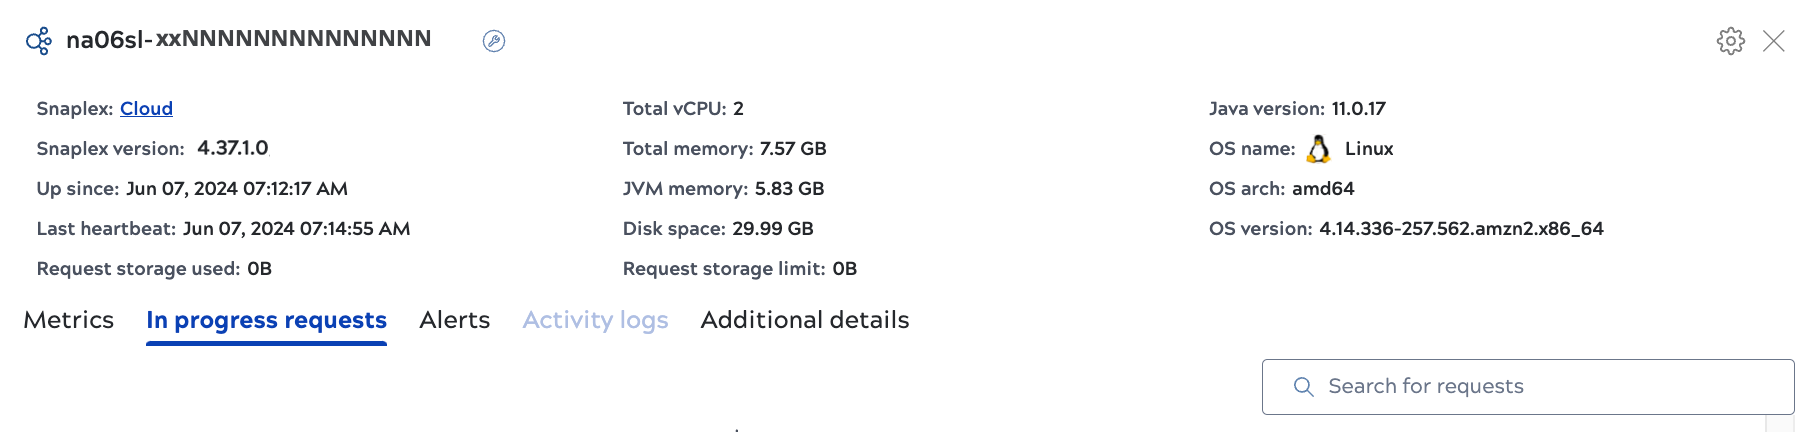
Node details include:
- The node name and status. The green arrow icon indicates the node is active.
- Snaplex: The parent Snaplex name. Click the name to open Snaplex details.
- Snaplex version: The parent Snaplex version.
- Up since: The date and time the node started.
- Last heartbeat: Nodes in a Snaplex send a heartbeat every 20 seconds to the Control Plane to indicate they're active. If the last heartbeat is not available or older than 15 minutes, the node is marked as inactive.
- Request storage used: The amount of disk space currently in use by the message queue. FeedMaster nodes queue requests waiting to be processed, which are stored on disk.
- Total vCPU: The number of CPUs on the virtual machine host.
- Total memory: The memory available on the host.
- JVM memory: The memory consumed by the JVM.
- Disk: The space for all mounts on the host and the percentage
currently in use.
- home: Disk space usage on the home directory.
- tmp: Disk space usage on the temp folder.
- Request storage limit: The limit set for disk use by the message queue. You can set this for Groundplexes. Refer to Deploy FeedMaster node for more information.
- Java version: The version of Java running the node.
- OS name: The OS of the host.
- OS arch: The chip architecture of the host.
- OS version: The host OS version.
Actions available from the header
From the header of the node details panel, you can:
- Click the Snaplex name to open Snaplex details.
- For self-managed Snaplexes, Org admins can click the gear icon to start, restart, or put the node in maintenance mode.
Metrics tab
The Metrics tab displays charts of CPU, disk, memory, and file descriptor utilization along with active threads and pipelines. Refer to Metrics for more information on chart data.
Associated executions tab
From the Associated executions tab:
- Click Open in execution view to open the Execution overview page, filtered by executions for this node.
- Search executions by string or click the Advanced search icon to filter by invocation type, status, or project.
- Download the pipeline execution history as a .csv file.
- Refresh the details.
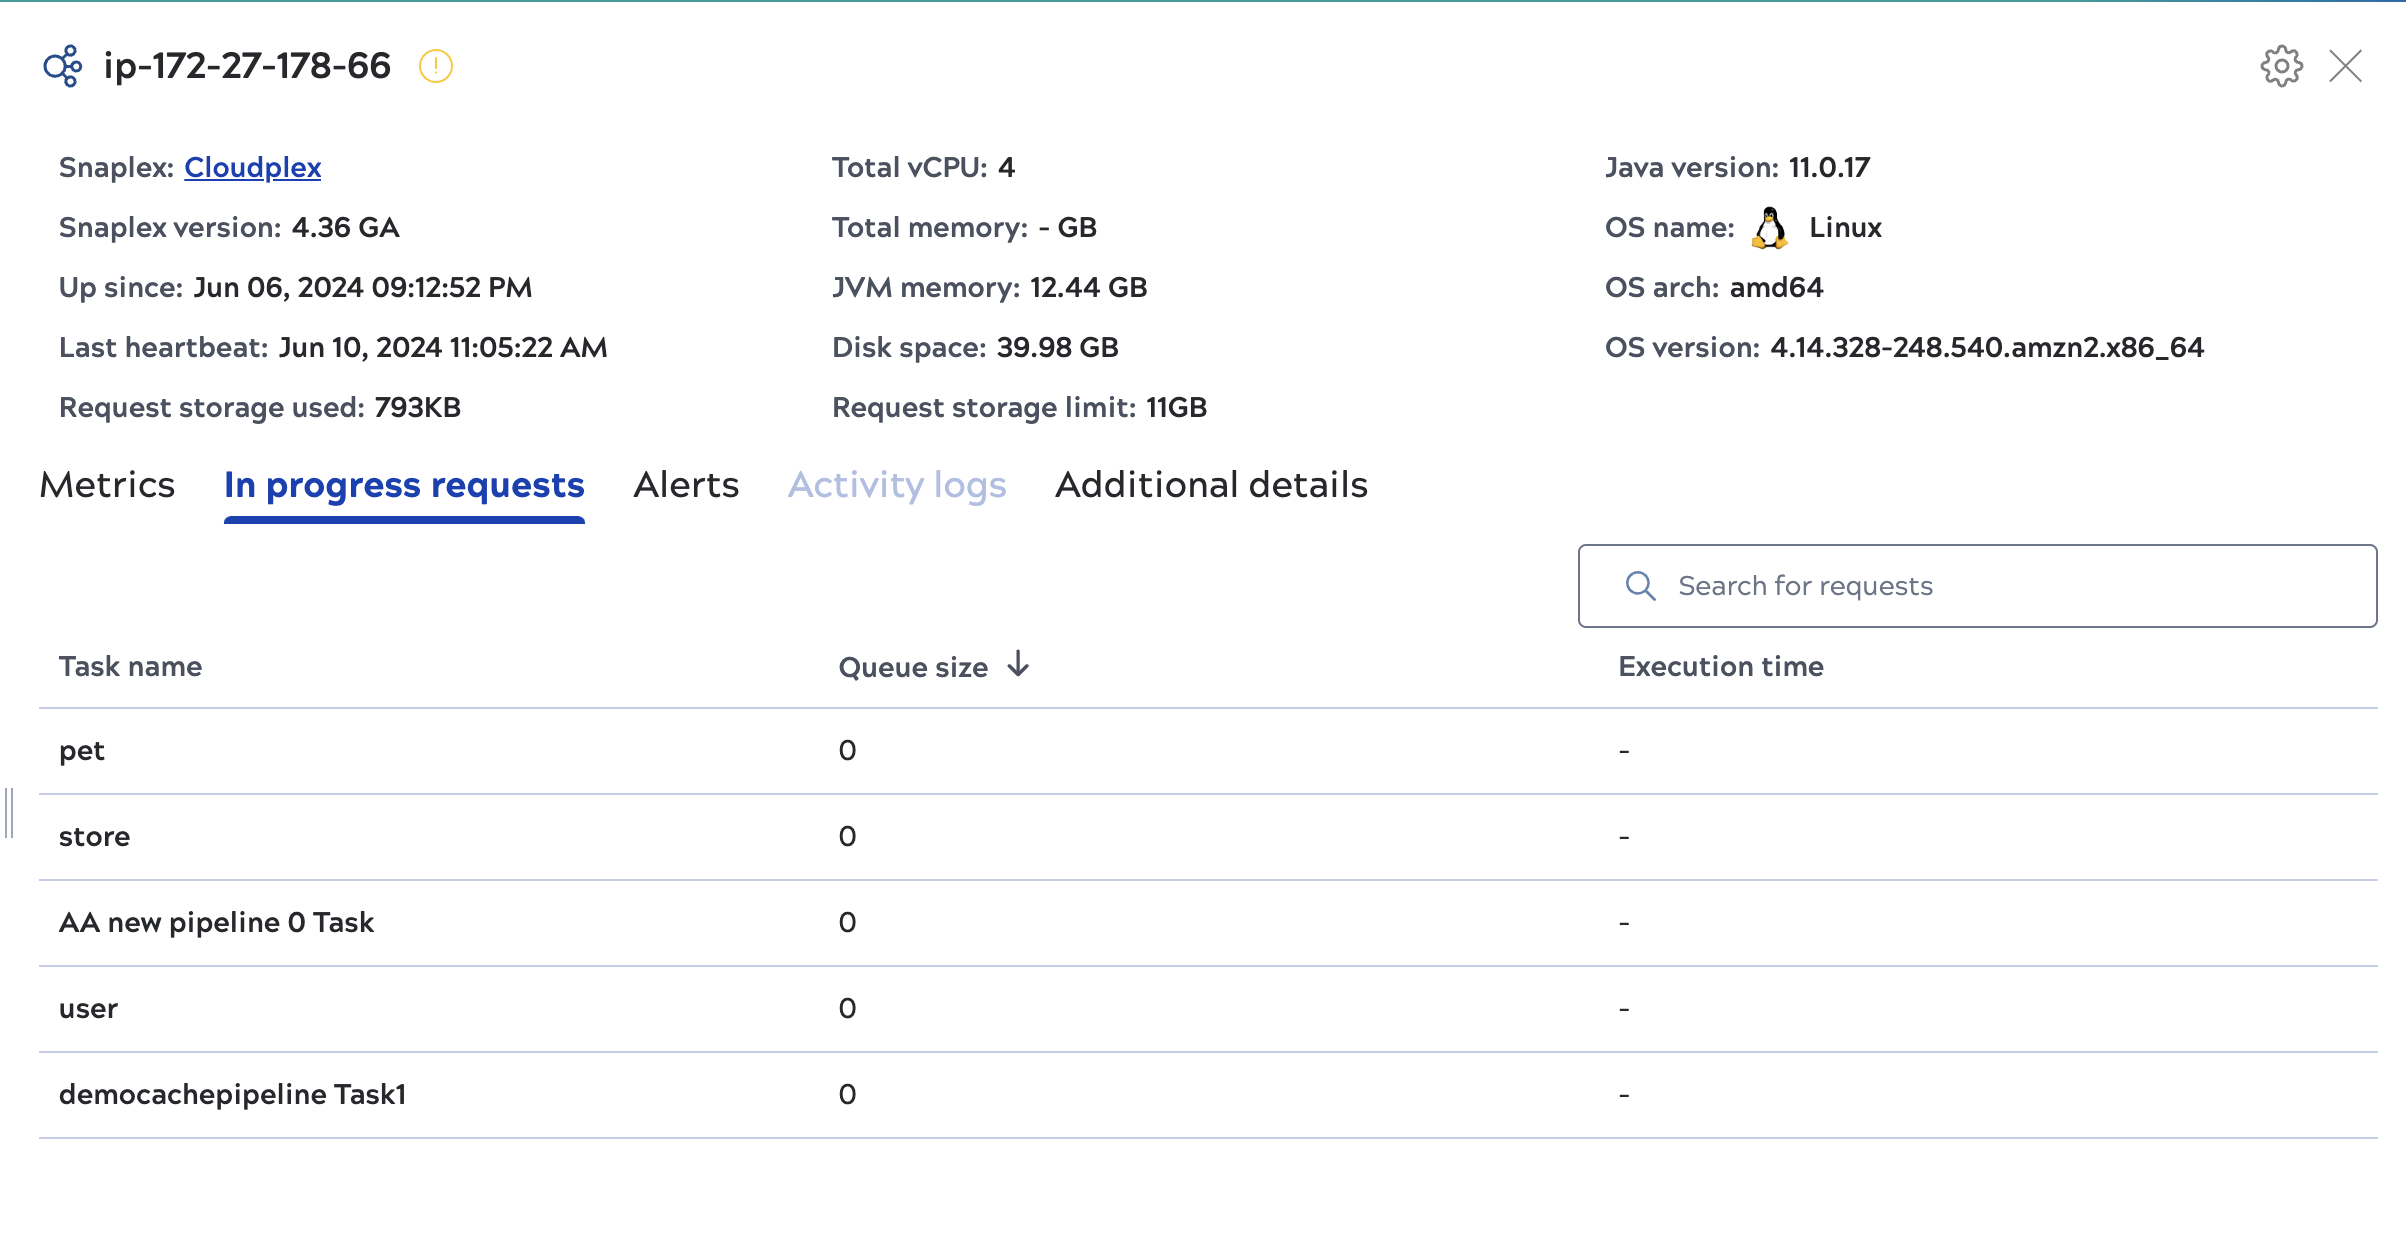
In progress requests tab (FeedMaster nodes only)
FeedMaster nodes process Ultra Task pipelines. The In progress requests tab shows how many requests are currently queued for each task and the execution time:
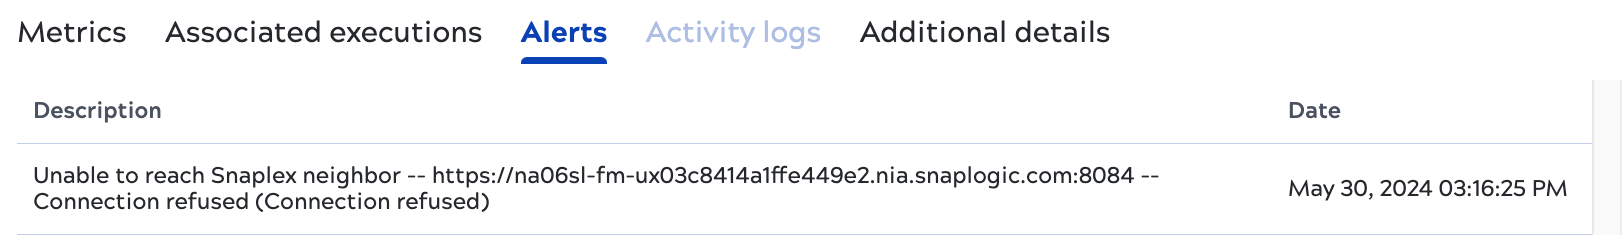
Alerts tab
The Alerts tab is empty unless an alert occurs in the selected time period. The following shows an alert when the node was unable to ping another node in the same Snaplex:
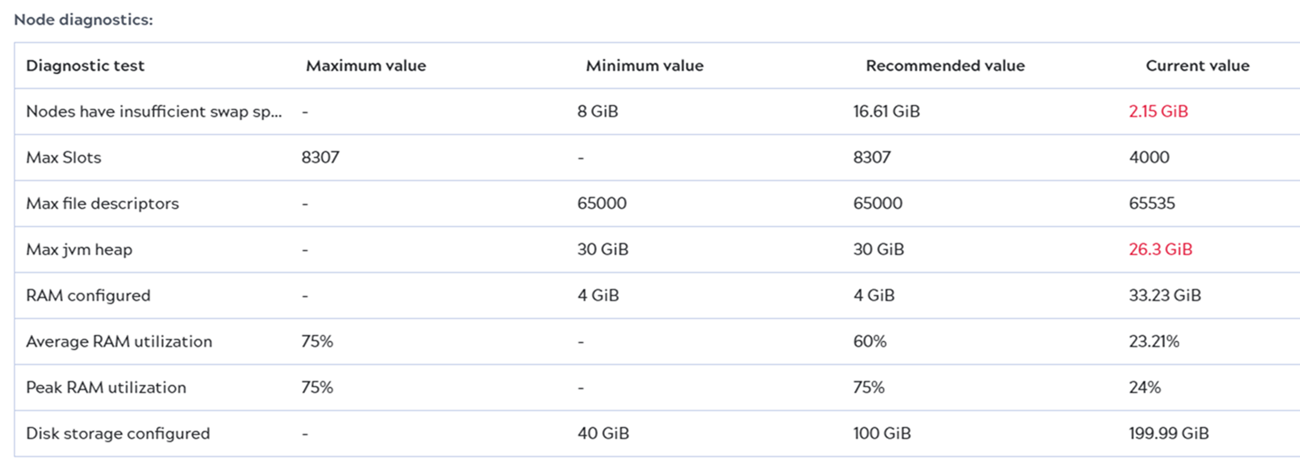
Additional details tab
The Additional details tab header displays:
- The node IP address
- The URI
- The secure URI
The Node diagnostics table includes data useful for performance tuning and troubleshooting. For configurable node settings and RAM use, the table displays the current, recommended, minimum, and maximum values. Values outside of the recommended range show in the top table rows in red text: