


Error handling
Error handling is a crucial aspect of building reliable data integration pipelines in SnapLogic.
Error handling is a crucial aspect of building reliable data integration pipelines in SnapLogic. It allows you to manage and process errors that may occur during pipeline execution. It is designed to ensure that your data integration pipelines can continue processing even when errors occur.
Error handling mechanism
-
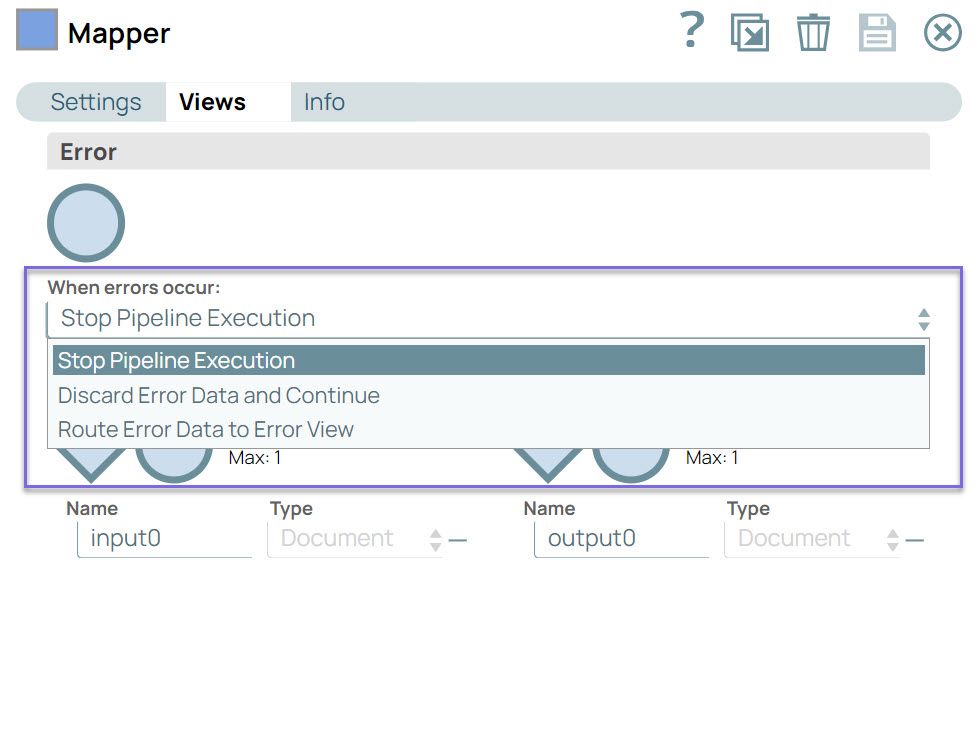
Snap setting: Configuring the When errors occur setting on the Snap Views tab of the Snap Settings dialog. Learn more.
-
Error Pipeline (global handler): If a Snap is configured to Route to Error Pipeline, the data is passed to an error-handling pipeline. Learn more.
-
Default platform behavior: If no specific setting is configured, the pipeline stops on encountering the error and fails.
Snap error handling
You can configure the Snap to handle errors in your pipeline by selecting an option from the When errors occur dropdown in the Views tab of the Snap settings.
| When errors occur | Description |
|---|---|
| Discard Error Data and Continue | This option discards the record with errors, if any, and continues with the
Snap execution. You might encounter partial or no data processing if you select
this option. |
| Route Error Data to Error View | Routes the error data to an error view without stopping the Snap execution.
If you manage errors in this manner within the pipeline, the overall status of the
pipeline will still show as completed. You can route errors to the error view and
decide how to manage them in the pipeline: store them in a file, log them, or take
specific actions based on the type of error. However, this approach is not recommended for handling errors throughout an entire project. This method is not scalable as pipelines evolve. Instead, consider alternative strategies for managing errors at scale. |
| Stop Pipeline Execution | This option stops the current pipeline execution when an error occurs.  When you hover on the failed Snap, you can view the error message, the reason for the error, and its resolution.  Click the Stats icon to view the detailed error message. 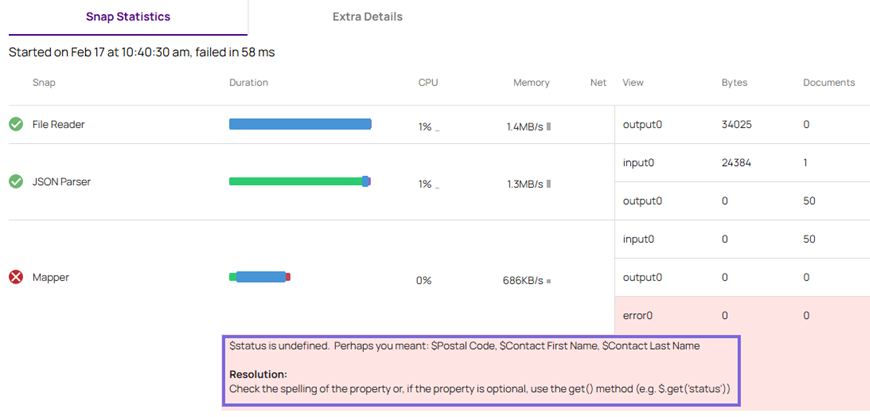 |
Error pipeline
An error pipeline is a pipeline that you can create specifically for handling errors. It processes error documents produced by other pipelines in your environment. When an error is encountered during pipeline execution, the error handling mechanism routes the error documents to an error pipeline. The main pipeline continues processing valid documents without being interrupted by errors. The error pipeline runs even if errors are not encountered in the Snaps from the main pipeline.
After the error pipeline is configured, the Route to Error Pipeline option is displayed in the Views tab of the main pipeline:
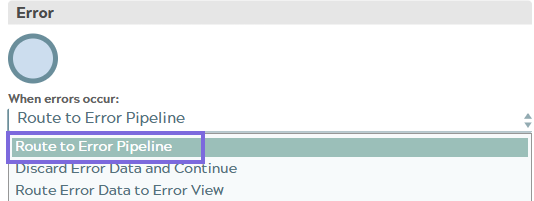
Select this option to route the errors to an error pipeline. Learn more about Working with Error Pipelines.
Error pipeline considerations
- You can invoke the error pipeline from any given pipeline from the same dialog (similar to the way that child pipelines are invoked).
- Add output to an error pipeline: If you need to customize an error document before
sending it to the error pipeline, you can change the Snap to Route Error
Data to Error View and then add any Snaps needed for
customization.
After you add the Snaps, you can then connect their unlinked output views to the error pipeline by selecting Route to Error Pipeline from the Views tab of Snap settings.
- When viewing a main pipeline with an error pipeline, you can view the errors by
clicking the Stats
 icon in the Designer toolbar. It
displays the number of documents that pass through the output and the number of
documents failed with errors.
icon in the Designer toolbar. It
displays the number of documents that pass through the output and the number of
documents failed with errors.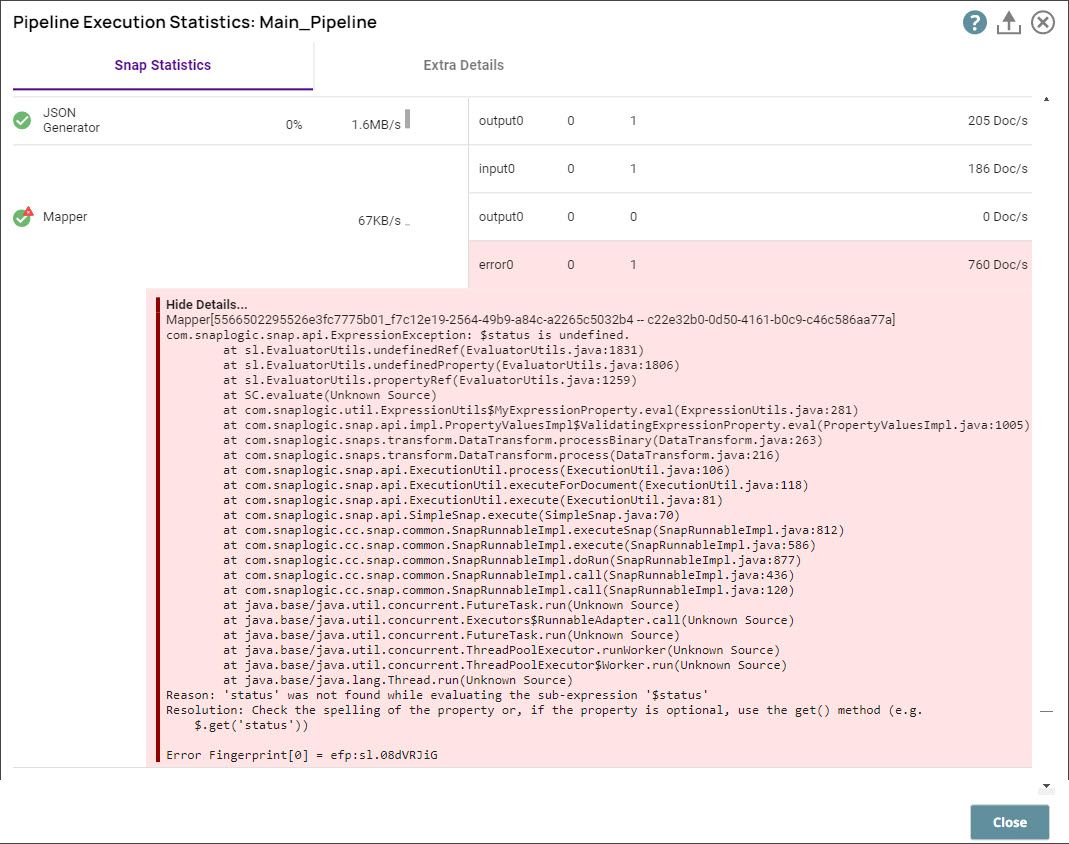
Error pipeline runtime characteristics
The duration of an error pipeline time is not tracked alongside the root pipeline, the way it is for children pipelines. In Monitor, the error pipeline might precede the root parent pipeline on the Pipeline Executions page. Likewise, in Open Telemetry Observability tools, the error pipeline runtime might precede the root pipeline runtime.
You can filter for Error Pipeline execution information by searching for invocation type. You can also use the Runtime Public API to get details about a specific pipeline runtime and its errors.