


Scheduled Task Queuing Preview
Task Queuing is a feature in the SnapLogic Platform that enhances Schedule Task executions with the goal of increasing resiliency. It improves Scheduled Task executions during resource contention by introducing the queue. When the system is overloaded, the Scheduled Task is added to a queue until sufficient resources are available to run the task.
Currently, if a node has hit resource limits when a Scheduled Task is set to run, the task will be rejected and result in a missed execution. With the Scheduled Task Queuing feature, the task will be handled gracefully via the queue.
If the Snaplex is at capacity when attempting to run a Scheduled Task and cannot accept the execution due to resource exhaustion, then the task will be queued and periodically attempt to reschedule itself until the execution time period expires. After a period of time, the task is dismissed. This time period is determined by the interval of the task and is determined based on the existing misfire calculation. If the interval between tasks is only a minute, the time period will be a matter of seconds. However, for intervals of an hour, the time period for retrying the task is increased.
Task Queuing has the following benefits:
- Increased task execution: Reduces loss of task executions
- Improved resource utilization: Optimizes node resource allocation
- Enhanced system reliability: Reduces errors and improves overall system performance.
Scheduled Task Queuing requires setting and Environment-level feature flag.
com.snaplogic.cc.service.scheduled.ScheduledTaskConfiguration.QUEUEING_ENABLED
To enable, set the feature flag to true.
To disable, set the feature flag to false.
We recommend that you enable this feature flag to your development environments before production environments. Consult your CSM about enabling the feature for your environment (Org).
The Task Queuing feature does not include updates to the UI or Scheduled Task form. However, if you enable the feature in your environment (Org), you should anticipate a change in behavior in the task run reporting on the Task Details page.
Task Status: Failed to Start Details: Task has been trying to start for 30.154s. Latest error: Not enough resources
        for a local execution.
Implications of the task queue
Monitoring and Alerting: The introduction of a queue necessitates new monitoring and alerting strategies to track queue health and performance. On the Notifications Center page in the Monitor app, you can set the following Task-specific alerts for Tasks.
- Task execution duration - percentage of normal
- Task execution duration - time limit
Task status: The Task Queuing feature modifies the delivery and meaning of the current status indicators, described below:
- Failed to start: Indicates a missed execution. Details provides the time, the time task was queued before it was skipped.
- Not started: Indicates a delayed execution that might still run. Details provides the time the task is waiting for resources to run the pipeline.
User Experience: You might experience increased delays in task execution at first. This can be remediated by modifying the times of your Scheduled Tasks.
- If the JCC node is restarted while queue is added for a Scheduled Task, the Scheduled Task queue will be set back to 0 after restart.
- If a Snaplex has too many pipeline executions, the Scheduled Task pipelines might slow down or stop executing.
The following image shows the Task Details page for Scheduled Tasks with the Task Queuing feature enabled:
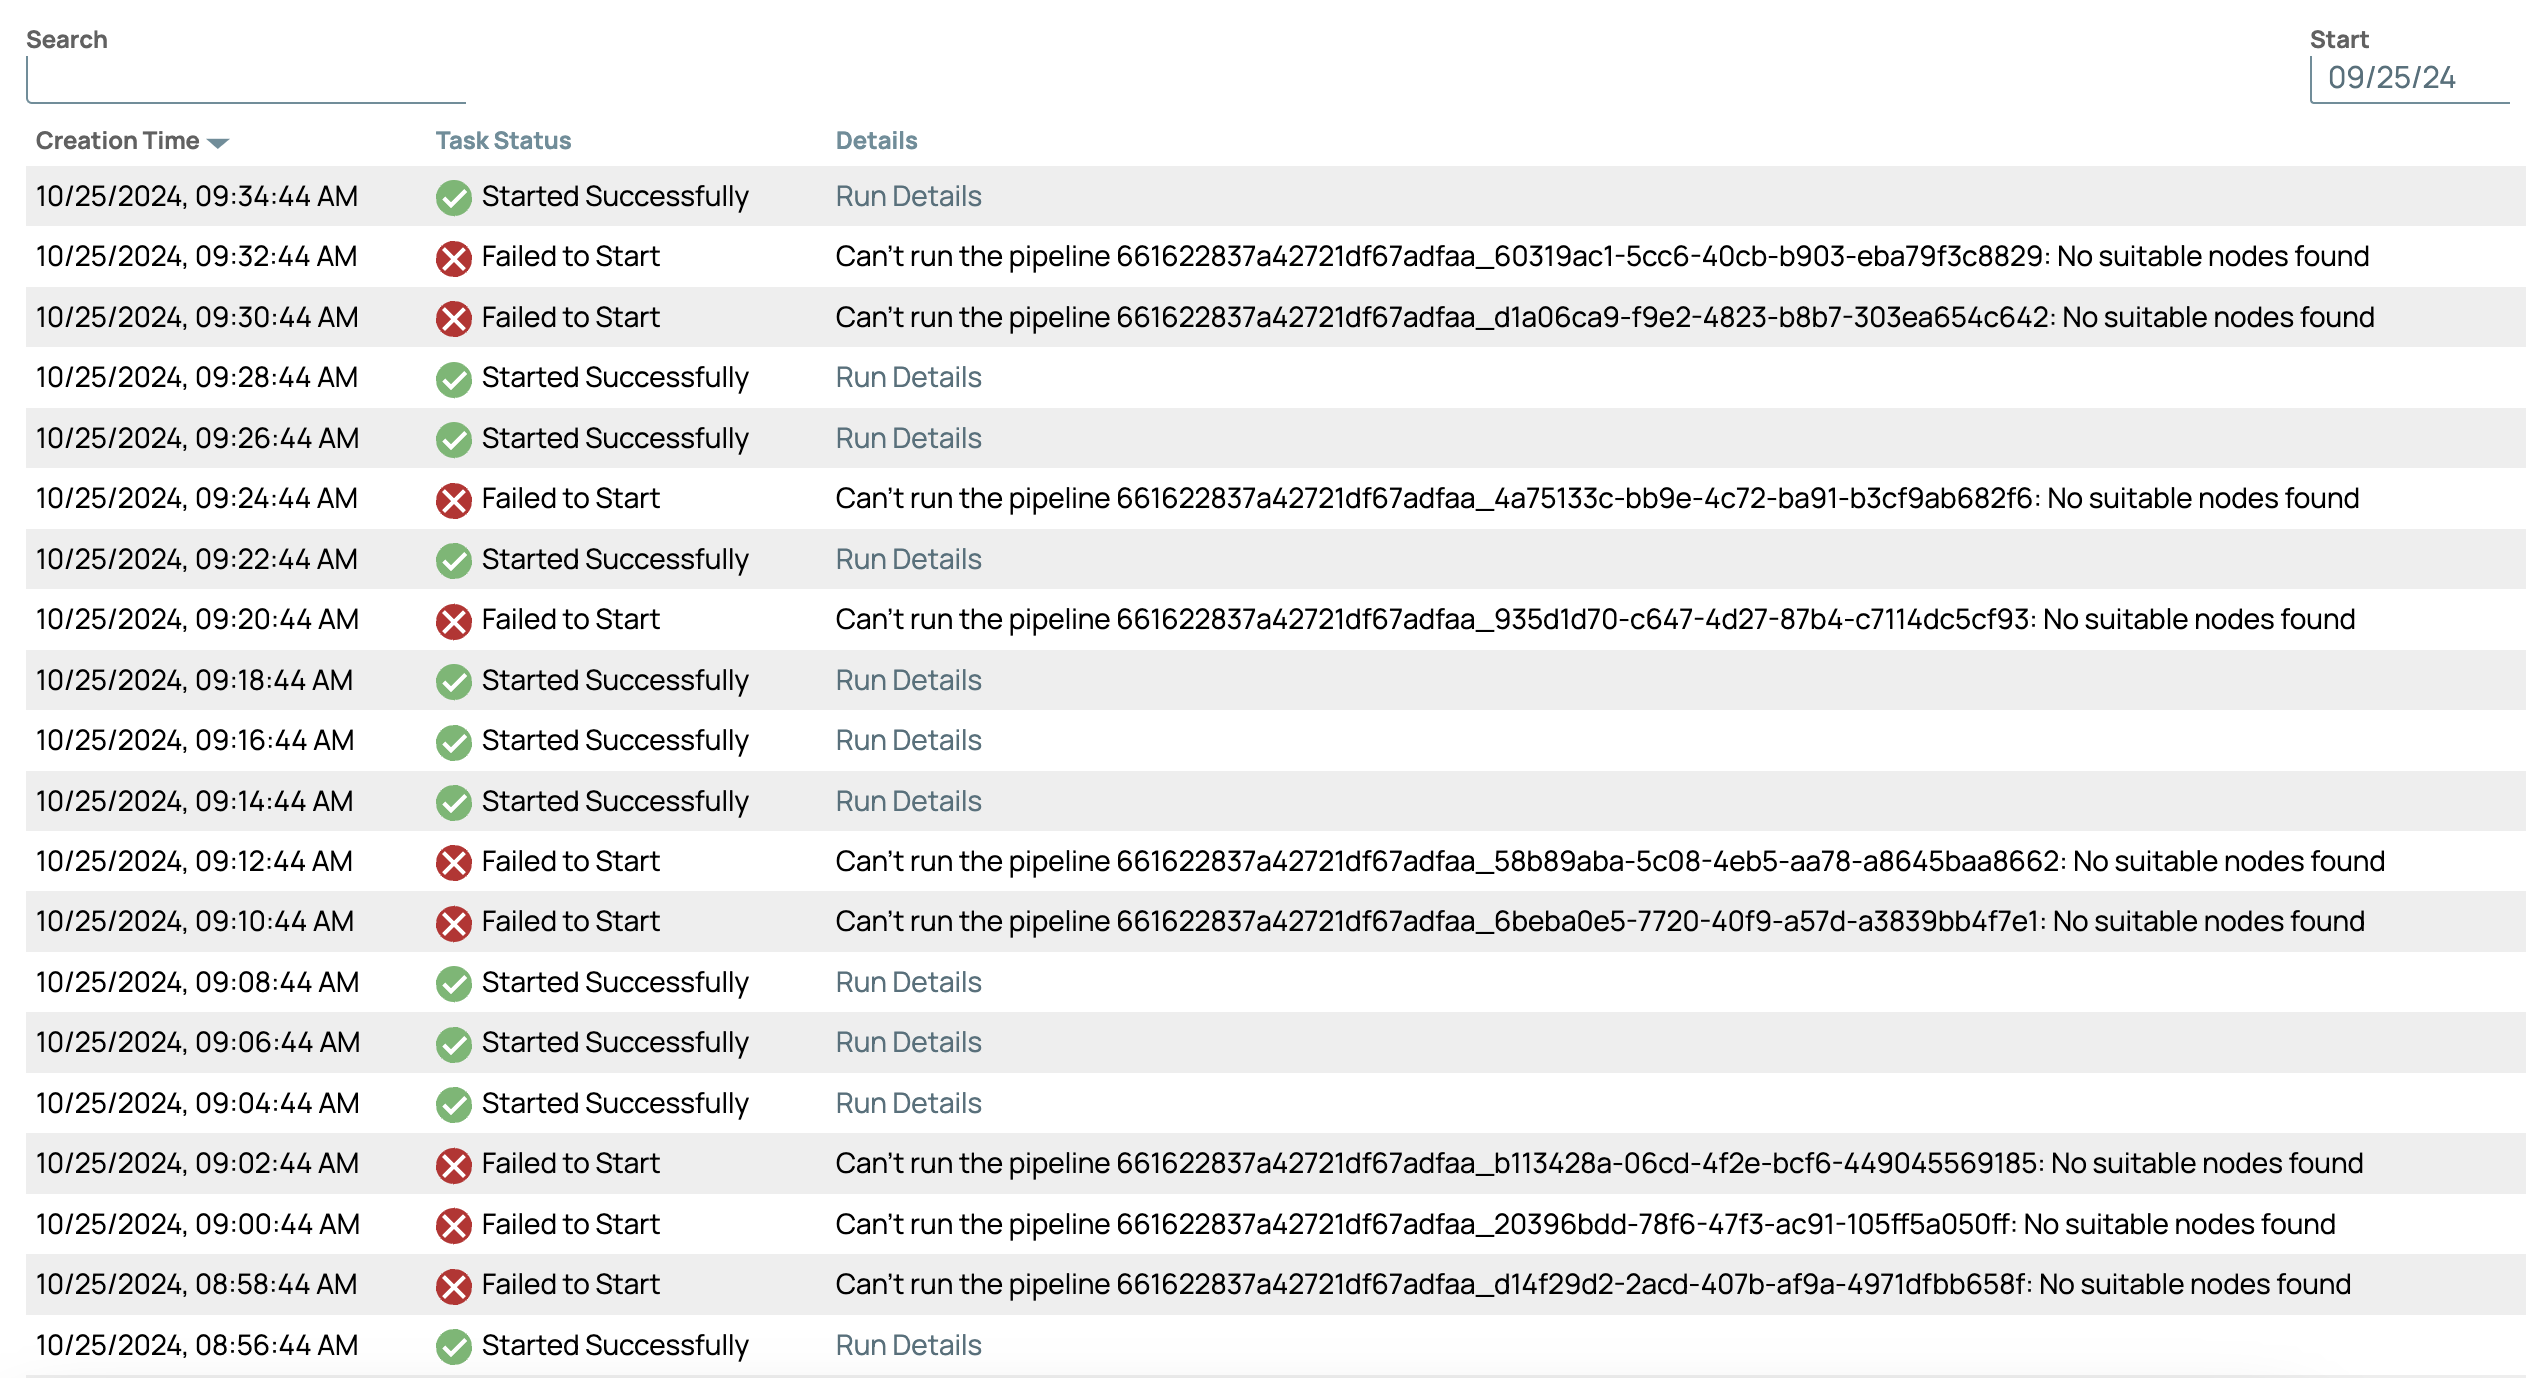
Note that when the Task Status is Failed to Start, the message in the
Details column indicates:
Can't run the pipeline example_name: No suitable nodes found.
Behavior change
The current implementation of Scheduled Task Queuing does not consider the current state of available memory since it's based on available slots. On the Snaplex JCC node, the pipeline interrupter will be triggered to stop stuck pipelines, which can be viewed in the Activity Log. For Open Telemetry deployments, you can track the following metrics to analyze patterns in executions.
plexnode.slots.leasedplexnode.slots.max