


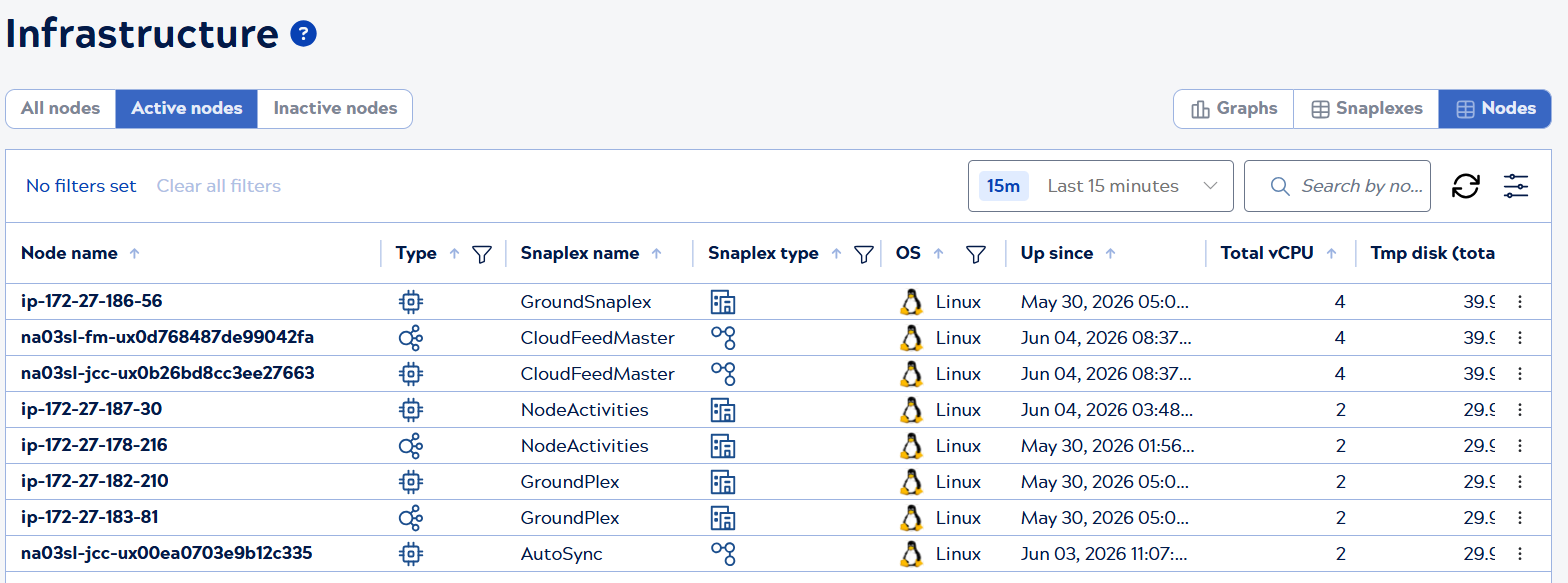
Infrastructure Nodes view
The Infrastructure Nodes view displays a table of individual nodes with detailed metrics and status information. Use the content selector to filter which nodes are displayed.
Content selector
Use the content selector on the left side to filter which nodes appear in the table:
- All nodes: Shows all nodes
- Active nodes: Shows only active nodes
- Inactive nodes: Shows only inactive nodes
The control plane marks nodes inactive after 15 minutes without receiving a heartbeat from them. Nodes in maintenance mode are also inactive. They have a Snaplex service running on them, but don't process requests. Nodes active for less than 15 minutes that stop unexpectedly don't display as inactive nodes. Nodes in maintenance mode show in the Infrastructure Inactive nodes filter, and have no associated data. Offline Snaplexes (those with no nodes) only show with the All nodes filter selected.
View selector
Use the view selector on the right side of the page to switch between Infrastructure views:
- Graphs: Visual display of resource usage
- Snaplexes: Table view of Snaplex-level information
- Nodes: Table view of individual node details (current view)
Page controls
Use the page controls to:
- Change the time period up to the last 45 days
- Search for nodes by name using the search box
- Refresh the table
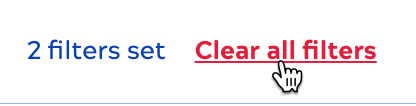
- Clear all filters:
- For the table columns:
- Apply filters by clicking
 on individual columns or click
  to open the Table configuration and filters dialog
 - Drag to resize
- Click
 to sort text and numeric columns
- Apply filters by clicking
- Click a node row to view its details panel
- Start, restart a node, or put it in maintenance mode by clicking the three-dot menu in the node's row. To find nodes in maintenance mode, select the Inactive nodes content selector
Table configuration and filters
Click ![]() to open the Table configuration and
filters dialog:
to open the Table configuration and
filters dialog:
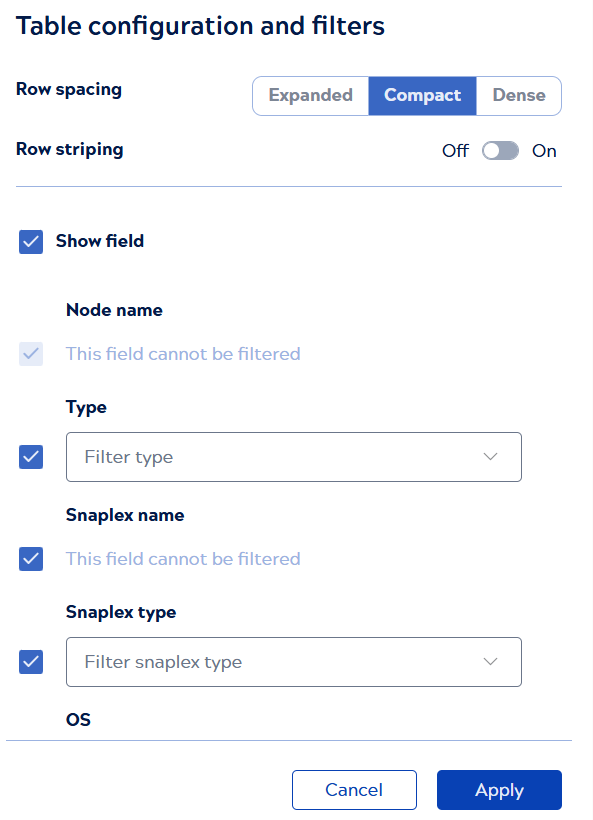
- Select any of the following row spacing options:
- Compact to show more table rows with the decreased row height.
- Expanded to show fewer table rows with the increased row height.
- Dense to display the same number of table rows as shown in the Compact view but with reduced icon size and padding.
- Enable row striping.
- Show or hide columns by checking or unchecking the box next to the name.
- Reorder columns by hovering near the name and dragging the handle that displays to the right.
- Filter columns by selecting one or more values from the dropdown list.
Click Apply to save the changes.
Table columns
The Nodes table displays the following columns:
| Column name | Description |
|---|---|
| Node name | Name of the node. |
| Type | Execution or FeedMaster. |
| Snaplex name | Name of the parent Snaplex. |
| Snaplex type | Self-managed (Groundplex) or SnapLogic-managed (Cloudplex). |
| Up since | The date and time the node started. |
| Total vCPU | The number of CPUs on the virtual machine host. |
| Total disk space | Total disk space on the host. |
| Total Memory | The memory available on the host. |
| Average CPU |
The average percentage of the node's CPU capacity used by the Snaplex service, calculated from all raw metric data points over the selected time period. |
| Average memory |
The average percentage of the heap space allocated and used by the Snaplex service on the selected node, calculated from all raw metric data points over the selected time period. |
| Average disk |
The average percentage of space used on all available mounts, calculated from all raw metric data points over the selected time period. |
| Status | Snaplex service status (Up and running, Not running, Alert, In transition, In Maintenance mode, Error) |