


Retrieve information about nodes
GET https://{controlplane_path}/api/1/rest/public/snaplex/{env_org}?{query_parameters}- If only
plex_pathis specified, it retrieves information about all the nodes in the Snaplex. - If both
plex_pathandhostnameare specified, it retrieves information about that specific node.
Prerequisites
- Environment (Org) admin permissions
Path parameters
| Key | Description |
|---|---|
controlplane_path |
Required. The SnapLogic control plane host:
elastic.snaplogic.com (US) or
emea.snaplogic.com (EU). |
env_org |
Required. The name of the SnapLogic environment/Org. For example,
My-Dev-Env |
Query parameters
| Key | Type | Description |
|---|---|---|
plex_path |
string |
The path to the Snaplex.
The path comparison is case-sensitive.
Format:
Default: All Snaplexes. |
hostname |
string | A single JCC node path or a comma-separated list of JCC node
paths.
Default: All JCC nodes. Example: |
Request header
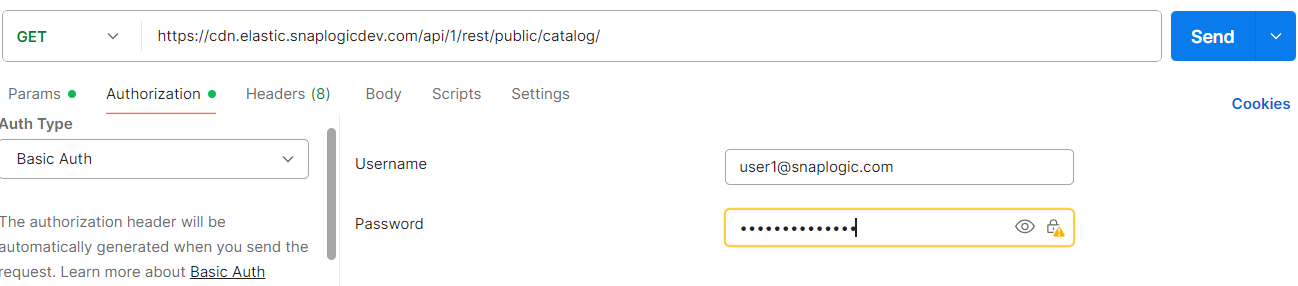
Basic authentication
To use basic authentication, specify Basic for authorization in the request
header, add your credentials (email and password for your SnapLogic user or service account), and
specify application/json for content type. For example:
Authorization: Basic {base64_encoded <email>:<password>}
Content-Type: application/json
Example of basic authentication using Postman:
JWT authentication
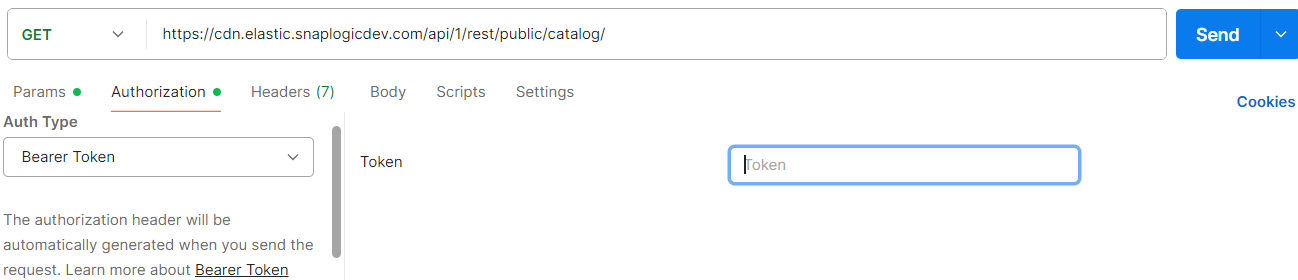
When using JWT authentication, the API request includes specific headers. In the request header,
specify Bearer Token for authorization, add the token, and specify
application/json for content type. These headers are automatically added when
you configure bearer token authentication in your API client. The authorization header contains
the word Bearer followed by a space and your JWT.
Authorization: Bearer Token {token}
Content-Type: application/json
Example of JWT authentication using Postman:
Request body
None.
Response
plex_info. Metadata related to the specified Snaplex.cc_info. Information about the JCCs running on the specified Snaplex.- Node details. Per-node statistics for all running and down nodes.
- FeedMaster
app_stats. FeedMaster-specific queue statistics, including Feed Master queue depth for Ultra Task monitoring.
 {
  "response_map": {
    "/myEnvOrg/path/to/snaplex": {
      "plex_info": { ... },
      "cc_info": { ... }
    }
  },
  "http_status_code": 200
}
plex_info fields
 "plex_info": {

  "org": "/myEnvOrg",
  "location": "myLocation",
  "environment": "myEnv",
  "min_jcc": 1,
  "container_type": "regular",
  "class_version": 3,
  "class_id": "com-snaplogic-snaplex",
  "class_fqid": "com-snaplogic-snaplex_3",
  "pkg_version": "4.34_rc-19616",
  "notification": {
      "recipients": ""
  },
  "disabled_notification": null,
  "reserved_slots": 15,
  "max_slots": 2000,
  "max_mem": 85,
  "jcc_load_balancer": "",
  "feed_master_load_balancer": "",
  "node_settings": {
      "published": {
          "heap": {
              "max_size": "auto"
          },
          "jetty_host": "0.0.0.0",
          "jetty_port": 8090,
          "cc_secure_port": null,
          "http": {
              "proxyHost": "",
              "proxyPort": null
          },
          "https": {
              "proxyHost": "",
              "proxyPort": null
          },
          "nodes": [ ... ]
      },
      "extra": [ ... ]
  },
  "node_settings_fp": "...",
  "dynamic_settings": {
      "log": {
          "level": "debug",
          "max_file_size": "300 MB",
          "main_backup_count": 40,
          "error_backup_count": 5,
          "access_backup_count": 5
      }
  },
  "restart_max_waiting_time": 15,
  "instance_id": "...",
  "load_avg_duration": 1,
  "plexfs_min_free": 25,
  "plexfs_retention_time": 14,
  "restart_request_time": "",
  "restart_request_user": "",
  "queue_size": 50,
  "label": "myPlexLabel",
  "snode_id": "...",
  "path": "/myEnvOrg/path/to/snaplex",
  "runtime_path_id": "myEnvOrg/rt/cloud/myEnv",
  "perms": [
      "A",
      "X",
      "W",
      "R"
  ],
  "owner": "[email protected]",
  "org_snode_id": "...",
  "lease_info": { ... },
  "time_leased": null,
  "time_created": "2023-03-08T20:11:08.346000+00:00",
  "time_updated": "2023-08-03T19:02:23.598000+00:00",
  "jcc_count": 2,
  "fm_count": 2
},
| Key | Type | Description |
|---|---|---|
org |
string | The name of the SnapLogic Environment/Org that the Snaplex belongs to, prefixed with /. |
location |
string | The location of the Snaplex. |
environment |
string | The environment of the Snaplex. |
min_jcc |
string | The minimum number of JCC nodes in the Snaplex. |
container_type |
string | The type of container (JCC node). |
class_id |
string | The identifier of the Snaplex. |
class_fqid |
string | The fully-qualified ID of a Snaplex. Format:
|
class_version |
integer | The version of the Snaplex schema. Three is the up-to-date version. |
pkg_version |
string | The SnapLogic package version that is installed in the Snaplex. |
notification |
string | A comma-separated list of email addresses to send notifications to. |
disabled_notification |
string | Notifications are not sent when disabled. |
reserved_slots |
string | The percent of slots to reserve for interactively executed pipelines. |
max_slots |
string | The maximum number of slots available on the Snaplex nodes. |
max_mem |
string | The maximum percent of memory that can be in use on the Snaplex nodes before they are considered overloaded. |
feed_master_load_balancer |
string | The URL to the FeedMaster nodes which serves as the Load Balancer (Ultra Load Balancer in the UI). |
jcc_load_balancer |
string | The URL to the JCC node which serves as the load balancer. |
node_settings » published |
object |
|
node_settings |
array | The settings for the nodes in the Snaplex. |
node_settings_fp |
string | Fingerprint of the JCC configuration. |
dynamic_settings » log |
object |
|
restart_max_waiting_time |
integer | The maximum waiting time for a JCC restart if a pipeline is running. |
instance_id |
string | Instance id of the Snaplex in the database. |
load_avg_duration |
string | The average load duration before scaling occurs. |
plexfs_min_free |
integer | The minimum amount of free space, in megabytes, that must be available in PlexFS for a reliable execution to proceed. |
plexfs_retention_time |
string | The number of days to retain files in PlexFS. |
restart_request_time |
string | Time when restart is requested. |
restart_request_user |
string | User who requested Snaplex restart. |
queue_size |
string | The maximum number of pipelines that can be queued up for the Snaplex. |
label |
string | The name of the Snaplex. |
snode_id |
string | snode id of the Snaplex in the database. |
path |
string | The path to the Snaplex. |
runtime_path_id |
string | Runtime path id of the Snaplex in the database, which is used to run tasks and pipelines. |
perms |
array | An array containing one or more of the following permissions:
Learn more: Permissions in Manager and in APIs |
owner |
string | The email address of the Snaplex owner. |
org_snode_id |
string | The ID of the Snaplex node that hosts the Environment/Org of the pipeline. |
lease_info |
object | Information about the Snaplex lease, if applicable. |
time_leased |
datetime | The date and time the Snaplex was leased, if applicable, in UTC format. |
time_created |
datetime | The date and time the Snaplex was created, in UTC format. |
time_updated |
datetime | The date and time of the last version update to the Snaplex, in UTC format. |
jcc_count |
integer | The number of JCC nodes in the Snaplex. |
fm_count |
integer | The number of FeedMasters in the Snaplex. |
cc_info fields
 "cc_info": {
  "running": [
    {
      "container_type": "regular",
      "label": "myCloudplex-jcc-a1b2c3d4e5f6a7b8",
      "stats": { ... },
      "performance": { ... },
      "cc_load": { ... },
      "app_stats": { ... }
    },
    {
      "container_type": "feed-master",
      "label": "myCloudplex-fm-a1b2c3d4e5f6a7b8",
      "stats": { ... },
      "app_stats": { ... }
    }
  ],
  "down": [ ... ],
  "label": "...",
  "runtime_path_id": "...",
  "snode_id": "...",
  "instance_id": "...",
  "path": "...",
  "owner": "[email protected]",
  "container_type": "regular",
  "time_created": "...",
  "time_updated": "...",
  "jcc_count": 1,
  "fm_count": 1,
  "location": "...",
  "max_slots": "..."
}
| Key | Type | Description |
|---|---|---|
running |
array | All the containers that were running when the API request was made.
Each item in the list is a map containing more details about the container. Entries can be either a JCC node (container_type: regular) or a FeedMaster node (container_type: feed-master).
|
down |
array | All the JCC nodes that were down and not processing requests when the API request was made. Each item in the list is a map containing more details about the container. For example, a message is returned under alerts if your Snaplex version is deprecated and needs to be updated. |
label |
string | The name of the Snaplex. |
runtime_path_id |
string | Runtime path id of the Snaplex in the database, which is used to run tasks and pipelines. |
snode_id |
string | snode id of the Snaplex in the database. |
instance_id |
string | Instance id of the Snaplex in the database. |
path |
string | The path to the Snaplex. |
owner |
string | The email address of the JCC node owner. |
container_type |
string | The type of container (JCC node). |
time_created |
datetime | The date and time the JCC node was created, in UTC format. |
time_updated |
datetime | The date and time of the last version update to the JCC node, in UTC format. |
jcc_count |
integer | The number of JCC nodes in the Snaplex. |
fm_count |
integer | The number of FeedMasters in the Snaplex. |
location |
string | The location of the Snaplex. |
max_slots |
string | The maximum number of slots available on the Snaplex nodes. |
Node details
The running array contains two node types, identified by container_type: regular (JCC node) and feed-master (FeedMaster node). Most fields are common to both types. The content of app_stats differs by node type; refer to FeedMaster app_stats for FeedMaster-specific fields including FeedMaster queue statistics.
Each node object contains the following fields:
 {
  "stats": {
    "cpu_user": 1,
    "cpu_util": 0,
    "disk_free": 53.18,
    "mem_used": 4,
    "mem_used_absolute": 922605376,
    "alive_since": 1609459200000,
    "cc_cpu_total": 4,
    "cc_mem_total": 16.0,
    "active_threads": 320,
    "leased_slots": 5,
    "open_file_descriptors": 250,
    "max_file_descriptors": 65536,
    "disk_info": [
      {
        "name": "/",
        "type": "ext4",
        "capacity": 107374182400,
        "free": 64424509440
      }
    ],
    "disk_total": 100.0,
    "mem_pool": { ... },
    "plexfs_stats": { ... },
    "system_load_average": 0.5,
    "neighbor_stats": { ... },
    "net_recv": 5.2,
    "net_sent": 3.8,
    "net_duration": 60,
    "active_pipelines": 3
  },
  "performance": {
    "eops_cpu": 7200000.0,
    "eops_wall": 6900000.0
  },
  "cc_load": {
    "stats": {
      "cpu_user": 0.04,
      "mem_used": 0.12,
      "active_threads": 320,
      "open_file_descriptors": 250,
      "system_load_average": 0.5,
      "active_pipelines": [ ]
    },
    "time_stamp": "2024-01-15T10:30:00.000000+00:00",
    "slots_in_use": 325
  },
  "app_stats": { ... }
}
| Key | Type | Description |
|---|---|---|
stats.cpu_user |
integer | The JCC process CPU utilization as a percent. |
stats.cpu_util |
integer | The system CPU utilization as a percent. |
stats.disk_free |
number | The amount of usable disk space available on the root filesystem, in gigabytes. |
stats.mem_used |
integer | The JCC process memory utilization as a percent. |
stats.mem_used_absolute |
integer | The amount of physical memory consumed by the JCC process, in bytes. Example:
|
stats.alive_since |
integer | The timestamp when the JCC node was started, in Unix time (milliseconds). Example:
|
stats.cc_cpu_total |
integer | The total number of CPU cores on the JCC node. |
stats.cc_mem_total |
number | The total amount of memory on the JCC node, in gigabytes. |
stats.active_threads |
integer | The total number of active threads running in the JCC process. |
stats.leased_slots |
integer | The number of slots currently leased for pipeline execution. |
stats.open_file_descriptors |
integer | The number of file descriptors currently in use by the JCC process. |
stats.max_file_descriptors |
integer | The maximum number of file descriptors available to the JCC process. |
stats.disk_info |
array | Information about disk volumes on the node, including name, type, capacity, and free
space. Example:
|
stats.disk_total |
number | The total disk space on the root filesystem, in gigabytes. |
stats.mem_pool |
object | JVM memory pool information for heap and non-heap areas. |
stats.plexfs_stats |
object | PlexFS statistics including usage and available space. |
stats.system_load_average |
number | The system load average over the last minute. A value of -1.0 indicates the metric is unavailable on Windows systems. |
stats.neighbor_stats |
object | Connectivity statistics for neighboring JCC nodes. |
stats.net_recv |
number | The amount of network data received per second, in megabytes. |
stats.net_sent |
number | The amount of network data sent per second, in megabytes. |
stats.net_duration |
number | The duration in seconds over which network statistics were collected. |
stats.active_pipelines |
integer | The number of pipelines currently executing on this JCC node. |
performance |
object | Performance benchmarking metrics for expression operations. |
performance.eops_cpu |
number | Expression Operations Per Second measured in CPU time. Example:
|
performance.eops_wall |
number | Expression Operations Per Second measured in wall-clock time. Example:
|
cc_load.stats.cpu_user |
number | The JCC process CPU utilization expressed as a decimal between 0.0 and 1.0. Example:
|
cc_load.stats.mem_used |
number | The JCC process memory utilization expressed as a decimal between 0.0 and 1.0. Example:
|
cc_load.stats.active_threads |
integer | The total number of active threads running in the JCC process. |
cc_load.stats.open_file_descriptors |
integer | The number of file descriptors currently in use by the JCC process. |
cc_load.stats.system_load_average |
number | The system load average over the last minute. |
cc_load.stats.active_pipelines |
array | Array of runtime UUIDs for pipelines currently executing on this JCC node. |
cc_load.time_stamp |
string | The timestamp when the cc_load statistics were last updated by the JCC node, in UTC
format. Example:
|
cc_load.slots_in_use |
integer | The number of slots currently in use on this JCC node. |
app_stats |
object | Application-layer statistics. Content differs by node type. On FeedMaster nodes (container_type: "feed-master"), contains Feed Master queue statistics. Refer to FeedMaster app_stats for details. |
FeedMaster app_stats
On FeedMaster nodes (container_type: "feed-master"), stats.app_stats contains the following fields:
 "app_stats": {
  "subscribers": [
    "myCloudplex-jcc-a1b2c3d4e5f6a7b8",
    "myCloudplex-jcc-b2c3d4e5f6a7b8c9"
  ],
  "destinations": [
    {
      "destinationName": "queue://{org}/{project-space}/{project}/{pipeline}_request",
      "size": 0,
      "enqueueCount": 5,
      "dequeueCount": 5,
      "dispatchCount": 5,
      "inflightCount": 0,
      "expiredCount": 0,
      "consumerCount": 1,
      "producerCount": 1,
      "averageMessageSize": 22741,
      "memoryUsage": 0,
      "memoryLimit": 2128084992,
      "memoryPercentUsage": 0,
      "messagesCached": 0,
      "storeMessageSize": 0,
      "minEnqueueTime": 0,
      "maxEnqueueTime": 1,
      "averageEnqueueTime": 0.6,
      "brokerName": "SnaplogicFeedBroker",
      "brokerId": "ID:myCloudplex-fm-a1b2c3d4.snaplogic.com-33511-1786585148312-0:1"
    }
  ]
}
| Key | Type | Description |
|---|---|---|
subscribers |
array | Labels of the JCC nodes currently connected to this FeedMaster's message broker. |
destinations |
array | ActiveMQ queue statistics for each Ultra Task pipeline registered with this FeedMaster. Each entry represents one pipeline queue. |
destinations fields
| Key | Type | Description |
|---|---|---|
destinationName |
string | Full queue path (URI) in the format queue://{org}/{project-space}/{project}/{pipeline}_request. Identifies the Ultra Task pipeline this queue serves. |
size |
integer | Current queue depth: the number of Ultra Task requests waiting to be processed. A value of 0 means the queue is empty; a rising value indicates the queue is backing up. Use this field for threshold-based monitoring (for example, alert when size >= 500). |
enqueueCount |
integer | Cumulative total messages published to this queue since the FeedMaster last started. |
dequeueCount |
integer | Cumulative total messages consumed from this queue since the FeedMaster last started. |
dispatchCount |
integer | Cumulative total messages dispatched to a consumer, including messages not yet acknowledged. |
inflightCount |
integer | Messages dispatched to a consumer but not yet acknowledged. |
expiredCount |
integer | Messages that expired before being consumed. |
consumerCount |
integer | Number of active JCC consumers listening on this queue. |
producerCount |
integer | Number of active producers sending to this queue. Typically 0 when no requests are being submitted. |
averageMessageSize |
integer | Average message size in bytes. |
memoryUsage |
integer | Bytes of broker heap currently used by this queue's messages. |
memoryLimit |
integer | Maximum broker heap allocated to this queue, in bytes. |
memoryPercentUsage |
integer | Percentage of memoryLimit currently in use (memoryUsage / memoryLimit × 100). |
messagesCached |
integer | Messages held in the broker's in-memory cache. |
storeMessageSize |
integer | Total bytes of persisted (disk-stored) messages for this queue. |
minEnqueueTime |
number | Minimum time in milliseconds a message spent in the queue before being consumed. |
maxEnqueueTime |
number | Maximum time in milliseconds a message spent in the queue before being consumed. |
averageEnqueueTime |
number | Average time in milliseconds messages spent in the queue before being consumed. |
brokerName |
string | Name of the embedded ActiveMQ message broker in this FeedMaster node. Always SnaplogicFeedBroker. |
brokerId |
string | Unique identifier for the broker instance, in ActiveMQ format (ID:<host>-<pid>-<timestamp>:<counter>). Changes each time the FeedMaster restarts. |
Use case: Proactive FeedMaster queue monitoring
Poll this API to track Ultra Task queue depth and trigger alerts before backlogs affect pipeline processing.
- Call the API for your Org.
- In the response, iterate the
runningarray and filter for nodes wherecontainer_typeisfeed-master. - For each FeedMaster node, read
stats.app_stats.destinations. - Check the
sizefield on each destination entry. A value of0means no requests are pending. A rising value means requests are queuing up faster than they are being processed. - Use
destinationNameto identify which Ultra Task pipeline the queue belongs to. - If
sizeexceeds your threshold (for example,500), send an alert to your monitoring tool (such as New Relic) with thedestinationNameand currentsizeas custom metric attributes.
The following example shows a FeedMaster node response where one Ultra Task queue has a size of 523, indicating 523 requests are waiting to be processed:
 {
  "container_type": "feed-master",
  "label": "myCloudplex-fm-a1b2c3d4e5f6a7b8",
  "stats": {
    "app_stats": {
      "subscribers": [
        "myCloudplex-jcc-a1b2c3d4e5f6a7b8",
        "myCloudplex-jcc-b2c3d4e5f6a7b8c9"
      ],
      "destinations": [
        {
          "destinationName": "queue://myOrg-prod/shared/DataIntegration/ProcessOrders_ultra_request",
          "size": 523,
          "enqueueCount": 1250,
          "dequeueCount": 727,
          "inflightCount": 2,
          "consumerCount": 2,
          "memoryUsage": 11534336,
          "memoryLimit": 2128084992,
          "memoryPercentUsage": 1,
          "averageEnqueueTime": 4200.5
        }
      ]
    }
  }
}
In this example, size: 523 exceeds the threshold of 500. The destinationName (ProcessOrders_ultra_request) identifies the specific pipeline queue that is backed up. Extract this value on each poll and push it as a custom metric to your monitoring tool to trigger an alert.