


Pipeline logs tab
View logs generated during a pipeline execution, filtered by level.
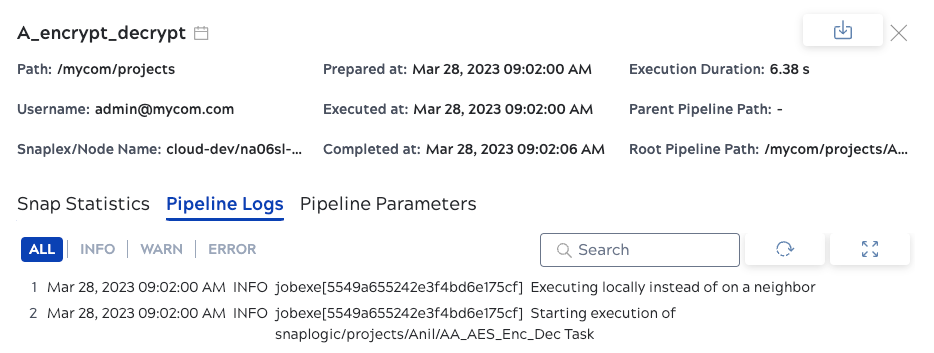
The Pipeline logs tab shows logs generated during execution. Monitor retains execution records for 45 days. Environment admins can find and download older logs from the Runtime Archive.
Filter logs by level using the ALL, INFO, WARN, and ERROR toggles. INFO messages record normal operational activity. WARN messages flag potential issues that didn't stop execution — review them even on successful runs to catch misconfiguration or deprecated behavior. ERROR messages indicate failures that caused the pipeline to stop or produce incomplete results.
From this tab you can:
- Download logs as a JSON file, or download a full runtime dump that includes Snap statistics, logs, pipeline parameters, and state transition data. Use the download icon in the panel header to access both options.
- With the optional Telemetry subscription, Groundplex users can forward pipeline logs to third-party observability tools using the OpenTelemetry (OTEL) standard, enabling centralized log aggregation, alerting, and distributed tracing outside of SnapLogic. Refer to Third-party observability tools.