


Alerts tab
The Alerts tab in the Notification center displays the alerts that Snaplex nodes generated during the specified time range. From this tab, you can view alerts and download alert logs and Snaplex logs to troubleshoot issues. You can address issues with self-managed Snaplexes (Groundplexes). SnapLogic manages issues with Cloudplexes.
Alerts have two states, open ![]() and closed
and closed ![]() . The system closes some alerts when the cause
of the alert resolves. You can manually close alerts from the three dot menu.
. The system closes some alerts when the cause
of the alert resolves. You can manually close alerts from the three dot menu.
- Problems during initialization.
- Congestion, when pipelines queue because the node is busy with other requests.
- Node crashes.
- Rejected connections.
- A node interrupts a pipeline that's using too much memory.
- A task duration notification is set and any task exceeds the specified execution duration.
- The daily API usage exceeds 75% of the limit.
- The concurrent API usage exceeds 75% of the limit.
Snaplex alerts include a state, event name, description, and date as shown in the image below:
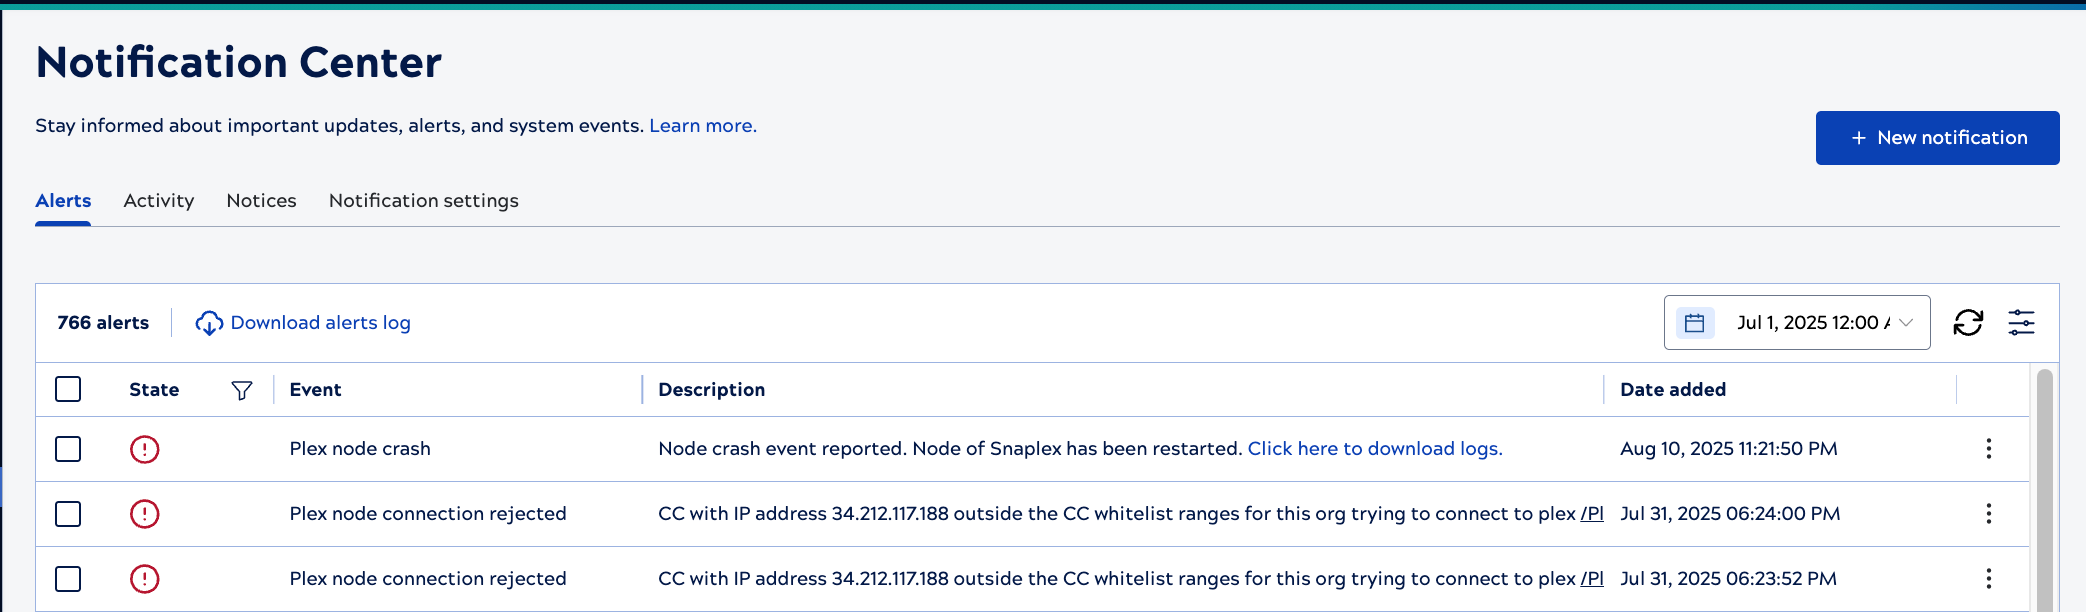
Use table controls to:
- Select the date range.
- Download alerts log: Download formatted alert data in CSV file format suitable for viewing and reporting.
- Download raw data: Download raw data with unformatted API fields in CSV file format for custom processing or integration with external systems.
- Refresh table data.
- Configure the table, by clicking
 . You can set row spacing to expanded or
compact, hide or show columns, and filter the State column.
. You can set row spacing to expanded or
compact, hide or show columns, and filter the State column. - Click the State column filter icon,
 , to filter by: All, Open, or
Closed alerts. A dark filter icon,
, to filter by: All, Open, or
Closed alerts. A dark filter icon,  , indicates that the column has a filter applied.
 - Close alerts that you've viewed or addressed. Click the three-dot menu in the alert row and select
Close.
- To download Snaplex logs, click the link in node crash alerts.
- For pipeline interrupter alerts, click the link to open the pipeline in Designer.
- To filter alerts for a specific Snaplex, click the Snaplex name in a node alert.
Snaplex congestion alerts
Snaplex nodes generate alerts when one or more pipelines run by a triggered task are queued for:
- More than 75% of their respective Time To Live (TTL)
- Five minutes.
A Snaplex only generates one alert regardless of the number of pipelines over the threshold. After generating an open alert, if there are no pipelines above the threshold for that Snaplex, the open alert resolves automatically and its state changes to closed.
Snaplex node threshold watermarks
You can adjust the behavior of Snaplex node alerts with threshold watermarks. In some scenarios, alerts for CPU, memory, or disk resource are triggered, but weren't directly caused by pipelines. For example, a disk alert might be triggered files accumulating in a /temp directory mounted on the Snaplex node. To address this case, an Environment admin can put the Snaplex in maintenance mode, and clear the space in the directory.
Threshold watermarks enhance the reporting accuracy of Snaplex node alerts and can reduce the frequency of alerts. With watermarks enabled, memory and CPU usage alerts close automatically when the usage falls below the lower watermark, which is 40% below the threshold. For example, a notification set to trigger at 80% for memory usage, closes when the memory goes below 0.4 * 80, or 32%. Similarly, a high watermark of 40% closes the alert. For example, when disk extends beyond 40% of the configured threshold, the alert is closed.
Watermarks aren't set by default. You can ask your CSM to configure the following threshold watermarks by enabling the feature flag for the environment and setting the watermarks:
-
com.snaplogic.cc.service.UsageMonitorServiceImpl.LOW_WATERMARK = 0.4
-
com.snaplogic.cc.service.UsageMonitorServiceImpl.HIGH_WATERMARK = 1.4