


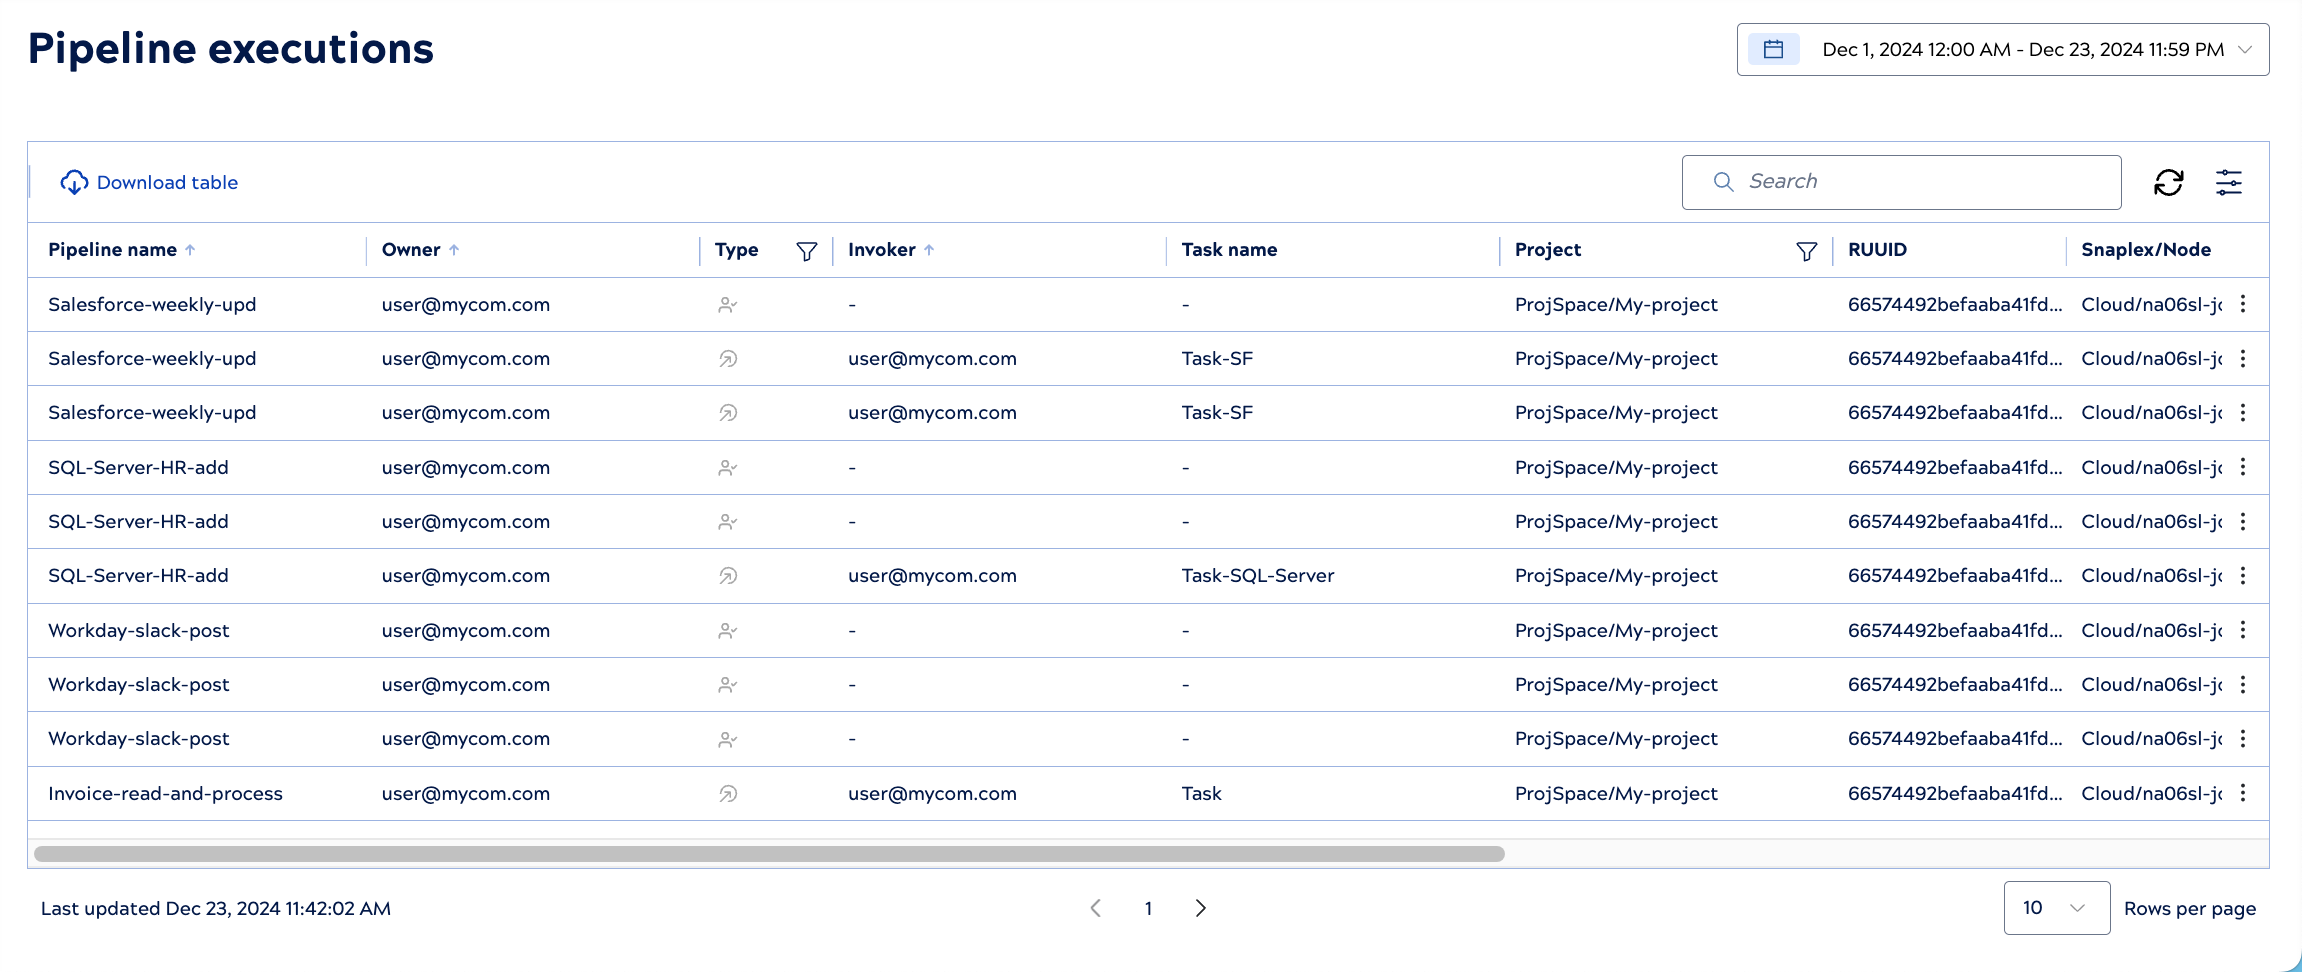
Pipeline executions
The Pipeline executions page shows integration executions and captures errors and warnings for troubleshooting. This page includes historical data up to 45 days old, or 15 days for Ultra Tasks. The Project Manager Runtime Archive provides links to individual JSON logs for executions that ran in the last three months.
Execution tables
Execution records appear in two tables: Running pipelines and Execution history.
| Table | What you can do |
|---|---|
| Running pipelines |
In the Running pipelines table, you can:
In the Running pipelines table, click the three-dot menu in a row to select any of the following:
You can click the Jump to Running link on the top-right to quickly navigate to the Running pipelines table. |
| Execution history |
In the Execution history table, you can:
In the Execution history table, click the three-dot menu in a row to select any of the following:
You can click the Jump to Execution history link on the top-right to quickly navigate to the Execution history pipelines table. Filter presets in the Execution history table provides a quick way to narrow down the execution list. The first time you open the Pipeline executions page, the Execution history table displays Completed executions. You can combine a time period with all quick filters to narrow the list of the executions you need to review. |
Table controls
| Download pipeline execution data to a CSV file. The execution of the pipeline duration is displayed in milliseconds. | |
| Refresh the table. | |
| Configure table row height, child execution nesting, set filters, reorder columns, and show or hide columns. Learn more. | |
| Filter pipeline executions by entering a search string or selecting values, and pressing Enter. Learn more. | |
| A dark filter icon indicates that a filter is applied to the column. | |
| Sort a text column alphabetically. |
Nested and Flattened grouping
Use the  toggle to switch the pipelines between showing children executions nested under
their parent or flattened. The Table configuration and filters dialog also includes
the Nested and Flattened row grouping option.
toggle to switch the pipelines between showing children executions nested under
their parent or flattened. The Table configuration and filters dialog also includes
the Nested and Flattened row grouping option.
- Nested: Child executions nest under their parent. With this
option selected, the table includes the first 100 most recent pipeline runs of the parent
pipeline.
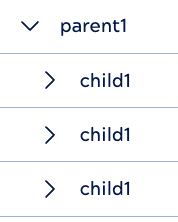
- Flattened: Parent and child executions show at the same level. With this option selected, the table displays data for up to 500 of the most recent child pipeline runs, even if the parent has more than 500 children. Because the Monitor limits the historical view to 45 days, the number of viewable pipelines might not reach 500.
Filter presets

- Errors: Selects pipelines that failed or completed with errors. The new state Completed with errors is displayed if any data routes to the error view. This arises when the Snap in the error pipeline has Format each document unchecked and Ignore empty stream unchecked, causing an empty output document.
- Stopped: Selects pipelines that were stopped by intervention.
- Completed: Selects pipelines that completed or completed with warnings.
- Ultra pipelines: Only present in environments with Ultra pipelines.
Table row contents and controls
- Pipeline name: Opens the Pipeline Execution Statistics in Designer, where you can view Snap statistics, pipeline parameters, and other details for this execution.
- Type: Opens the Task Details in Project Manager.
- Task name: Opens the Task Details in Project Manager.
- Project: Opens the project that contains the pipeline and task in Project Manager.
Click the Filter icon next to the column headers to filter the pipelines. The following filters are available for pipeline executions:
- Type: Filters the executions based on the pipeline type.
- Status: Filters the executions based on the pipeline status.
- Project: Filters the executions based on the following:
- My Executions: Filters the execution list to show only the pipelines that you have executed. This filter is selected by default for the non-admin users. You can combine this filter with individual project selections to view your own executions and those from the selected projects.
- All projects: Displays executions across all the projects you have access to, without needing to select them individually. This filter is selected by default for the admin users. When selected, individual project checkboxes are disabled. This filter displays all executions as per your permissions, regardless of which projects they belong to.
-
Snaplex/Node: The Snaplex filter for this column lists only active Snaplexes. When you select a Snaplex from the list, the tables display the pipeline runs executing on that Snaplex. For example, when viewing Ultra Pipelines, the Snaplex filter displays the active Snaplexes on which those Ultra Pipelines are running. This column displays:
-
The Snaplex environment in which the pipeline ran (such as Cloudplex or Groundplex).
-
The specific node name or IP address that processed the execution. For example,
GroundPlex/ip-172-27-186-109
Note:Except for the Pipeline name column, you can add or remove the other columns in the Table configuration and filters dialog. Learn more.
-
- Owner: Displays the email ID of the user who executed the pipeline.
-
Invoker: This column indicates who initiated the pipeline execution. It typically shows the user ID of the person who manually started the pipeline or the system information for triggered tasks.
-
RUUID: A unique identifier assigned to each pipeline execution instance. The RUUID is crucial for tracking and troubleshooting as it allows you to reference the exact execution in logs, reports, and when communicating with support.
-
Duration: The total time the pipeline takes to complete execution, typically displayed in seconds or milliseconds. It's calculated as the difference between the start and end times.
-
Documents: This column shows the number of data documents processed during execution. This metric provides insight into the throughput and volume your pipeline handles, which is useful for performance analysis.
- They own the parent pipeline.
- They have read permission for the project that contains the parent pipeline.