


Monitor FAQs
Frequently asked questions:
- What is Monitor?
Monitor is a leap forward in observability and user experience for all monitoring, troubleshooting and reporting needs. Monitor advantages include:
- 10-second metric granularity, which enables you to catch spikes and issues in near real time.
- Metric visualizations that include dynamic downsampling, zoom, filters, and time-range drilldowns. You can view graphs for single nodes, all execution nodes, or all FeedMaster nodes.
- The Infrastructure page includes Graph and List views, per-node insights, and Snaplex versions at a glance.
- The Asset catalog surfaces metadata for pipelines, tasks, accounts, and supports quick navigation to related assets.
- Is Monitor ready for prime time?
Monitor is ready for general use.
- What has SnapLogic done to ensure that Monitor is ready?
We've conducted focused interviews with customers to gather feedback on features, usability, and performance. We've made a number of enhancements from this direct feedback and our own feature gap analysis.
- Where do I check on Ultra Tasks?
On the Pipeline executions page, click the Ultra pipelines quick filter.
- How do I reproduce or share a filtered view of pipeline executions?
Perform a search. After a search, the page URL contains the search string, filters, and column preferences, which you can bookmark and share.
- Where can I see the Task Health summary in Monitor?
The Asset catalog shows 30 days of task execution statistics. Enterprise customers have access to the Asset catalog. By default, it's only visible to Environment admins, but they can open it for all users from the Admin Manager Asset catalog page. To view task health in the Asset catalog, select a task from the Tasks tab, and click Execution statistics.
- How do I tell if nodes are running cold or hot?
Open the Infrastructure page. The default graph view color codes node bars to indicate what’s running hot and cold. Snaplexes with cooler nodes are at the bottom of the page, Snaplexes with higher values show at the top.
- Where do I find node count and size?
From the Infrastructure page, click a node in the graph or list view to view its details.
- Where do I find the Snaplex version?
From the Infrastructure page, click a Snaplex to open the Snaplex details panel.
- How do I identify FeedMaster nodes?
On the Infrastructure page, the graph and list view identify regular nodes with the
 icon and FeedMaster
nodes with the
icon and FeedMaster
nodes with the  icon.
icon.
- What should I be checking in the metric charts?
Monitor offers a short description of each metric just below the name. Refer to Graph descriptions for detailed descriptions.
- I see CPU and memory utilization at the node level, but where do we find the Snaplex
level?
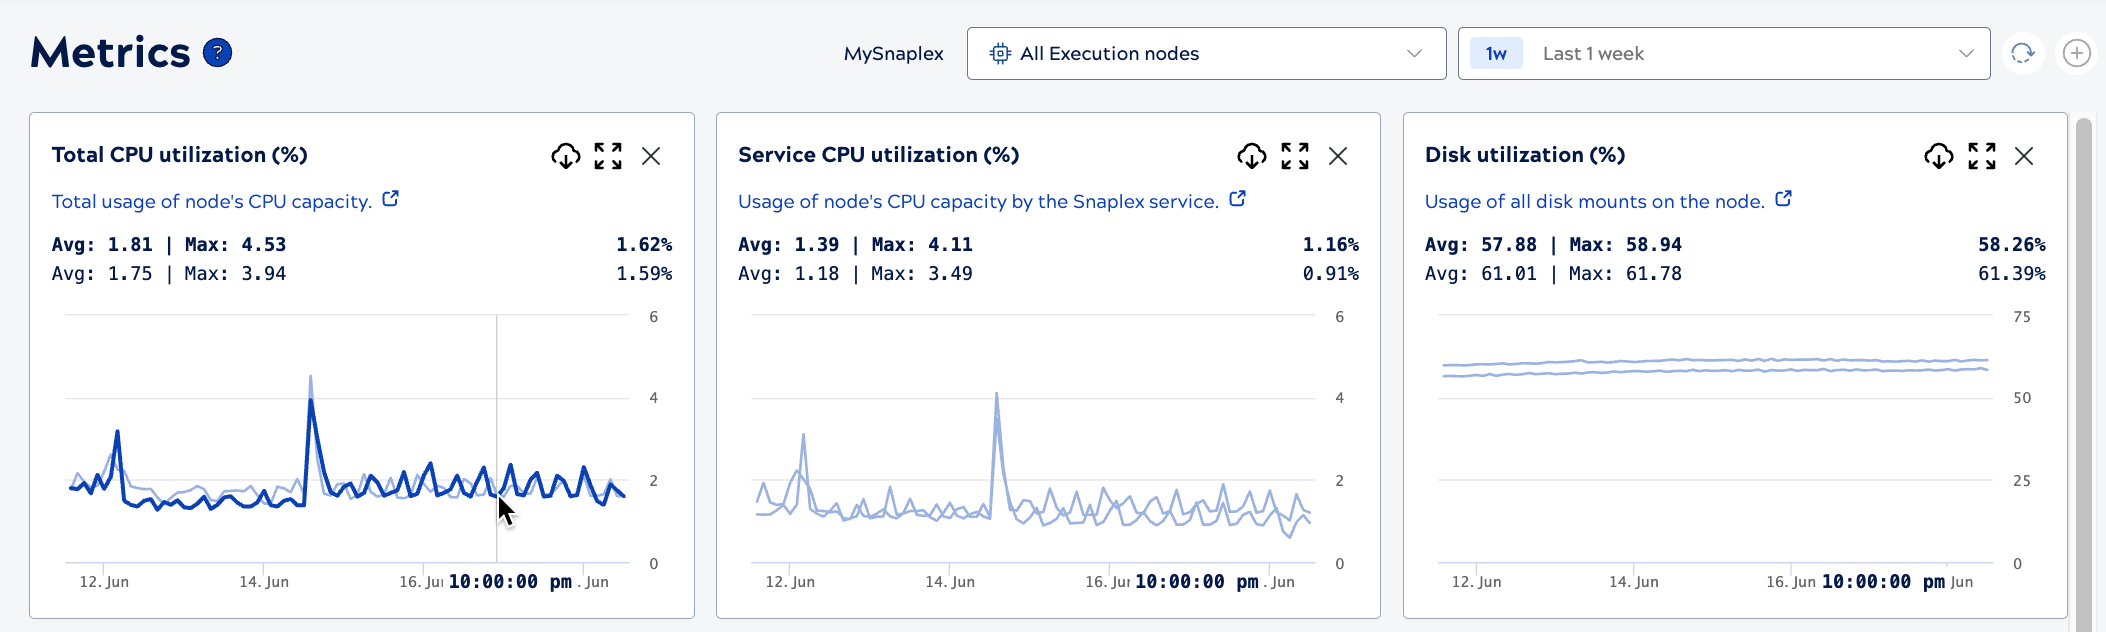
We removed the initial aggregated Snaplex metrics view that caused some confusion. A new and improved Snaplex metrics view is now available that shows all execution nodes or all FeedMaster nodes in the same set of graphs. From the Metrics page, select a single node, All Execution nodes, or All FeedMaster nodes.
The following shows example graphs for a Snaplex with two execution nodes. In the first graph, the bold line indicates the node the cursor is hovering on. A click on a line opens the metric graphs for the selected node.
- I can't find these properties for a Snaplex node: External IP address, active threads,
and number of open file descriptors.
In Monitor:
- The external IP address is in the Additional details tab on the Node details panel. From the Infrastructure graph or list view, click a node to view the details panel. Refer to Additional details tab for a screenshot.
- Find a graph of active threads on the Metrics page. Refer to Graph descriptions for more details.
- Find a graph of open file descriptors on the Metrics
page. The graph presents usage as a percentage. To calculate the absolute value, take the
maximum file descriptors multiplied by (file descriptor utilization percentage divided by
100). Expressed as a formula:
Absolute Value = Max_File_Descriptors *
                  (File_Descriptor_Utilization_percent / 100)
.
- Why do I have to reset the time period every time I log in?
To save often used time periods, select one and bookmark the page, because the URL includes them. You can also share these bookmarks with colleagues.
- Where do I share feedback?
Send an email to: [email protected]. We'd love to hear your thoughts.