


Asset catalog
The Monitor Asset catalog shows your tasks, pipelines, and accounts, and the relationships between them. It includes metadata that isn't available anywhere else in the SnapLogic Platform. This metadata comes from three sources:
- Factual: Verifiable attributes that the SnapLogic Platform captures directly, such as task name, pipeline name, task type, owner, schedule, execution details, and associated Snap accounts.
- Inferred: Attributes that the Asset catalog infers from factual metadata, such as source and destination endpoints.
- Supplemented: Custom metadata that Environment admins can add to the catalog.
Having this metadata in one place offers:
- Central governance for DataOps teams
- Simpler impact analysis for system architects
- Easy identification of reusable assets for data integrators
- Business-specific, contextual metadata that data analysts can add
- Insights into operational metrics
By default, the Asset catalog is visible to everyone. Non-admins can view only assets that they have at least read access to. On the Admin Manager Asset catalog page, Environment admins can restrict Asset catalog visibility to Environment admins only.
How to use the Asset catalog
The Asset catalog has a tab for each asset type: Tasks, Pipelines, and Accounts. Each tab shows a table of assets with a toolbar above it and a totals row below it.
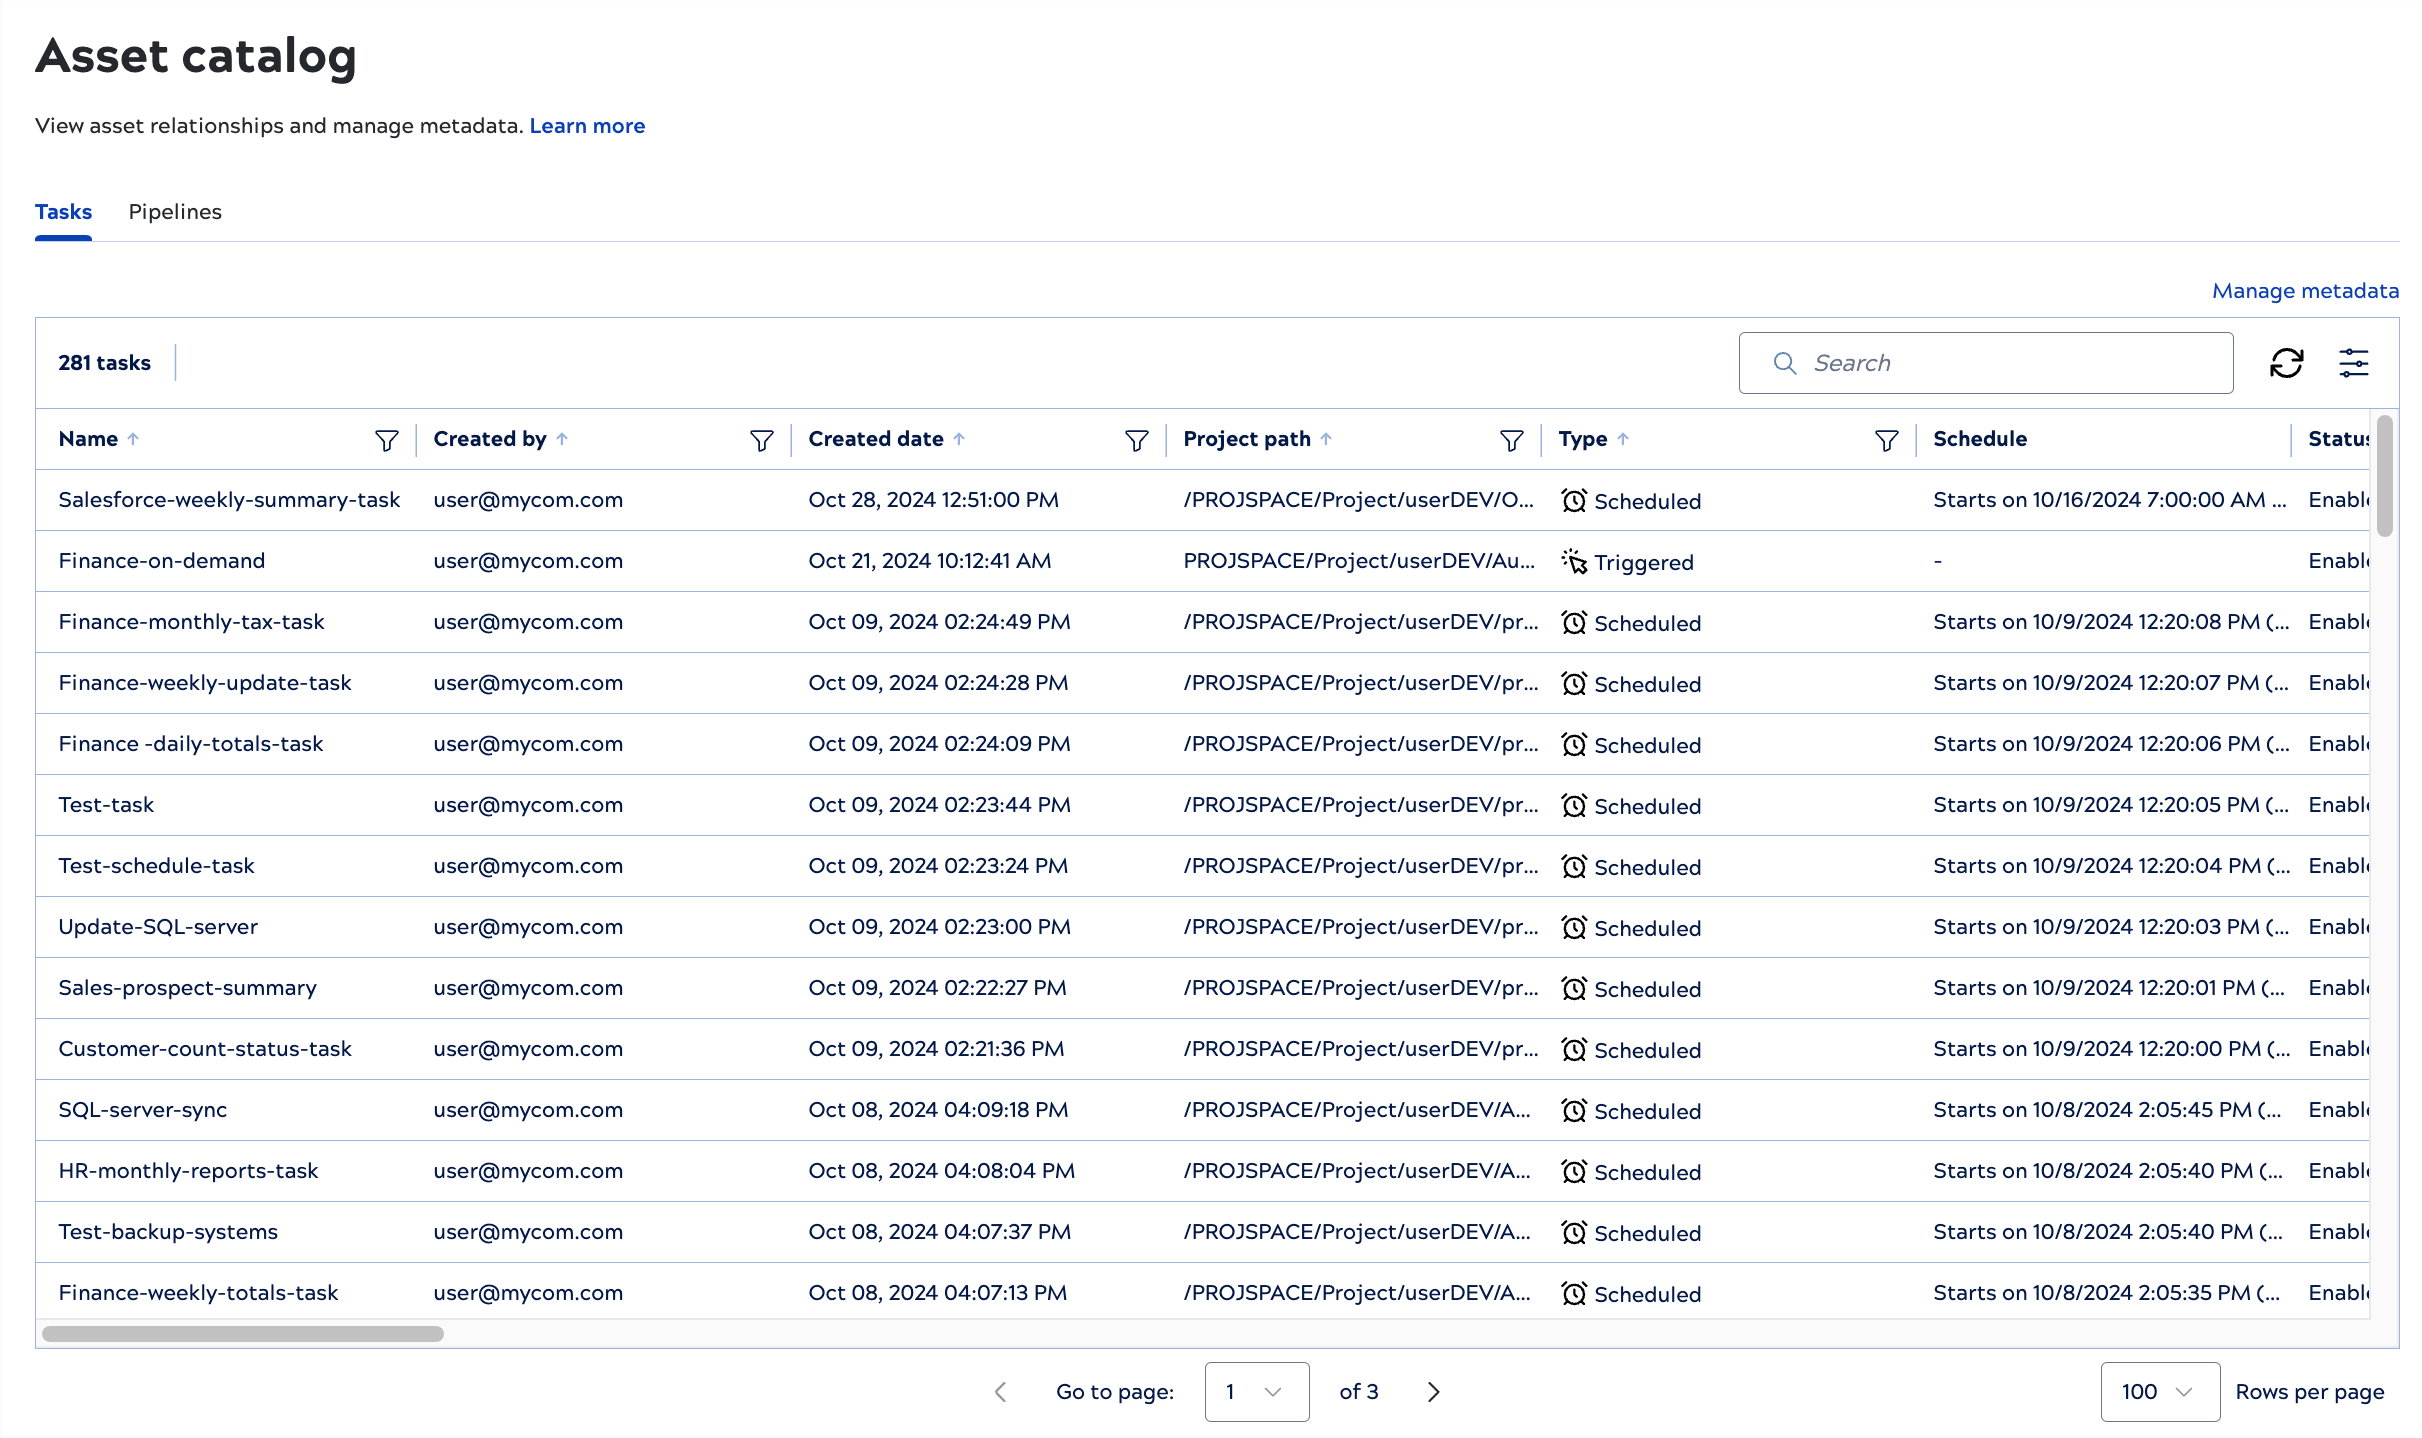
Page controls include:
- 7d, 30d, 90d: Show metrics for the last 7, 30, or 90 days. The default is 30 days. Click More to set a custom range.
- Search: Find assets by name.
 : Filter a column. Click Clear all filters to remove all
filters. Each custom metadata field appears as its own
column that you can filter.
: Filter a column. Click Clear all filters to remove all
filters. Each custom metadata field appears as its own
column that you can filter. : Reload the table data.
 : Show, hide, or reorder columns and change the table layout. Refer to Configure the asset table and filters.
- Download: Save the current view as a CSV file. The file includes the filtered rows and the selected date range.
- Manage metadata: Download and upload metadata.
The totals row summarizes numeric columns. It includes every row that matches the current filters and date range, not only the rows on the current page.
- Total: The sum of all values
- Average: The weighted average of all values
Columns without an aggregation show no value in the totals row.
Asset relationships
In any tab, select an asset to view its details and related assets. Related assets show you, for example:
- The pipelines that use a specific account
- The tasks that run a specific pipeline
- The executions of a pipeline from a specific task
- The parent and child pipelines of a pipeline
When you configure a pipeline to use an account, the Asset catalog adds the association at the next synchronization. When you remove the account from the pipeline, the Asset catalog removes the association at the next synchronization. However, if a pipeline execution used the account, the Asset catalog keeps the association for 30 days after the configuration change.