


Troubleshoot APIM requests and Ultra Tasks
- Implementation: Pipeline, Policy, and Snap configuration errors.
- Runtime: Node misconfiguration or external factors such as latency, loss of connectivity, or upstream failures.
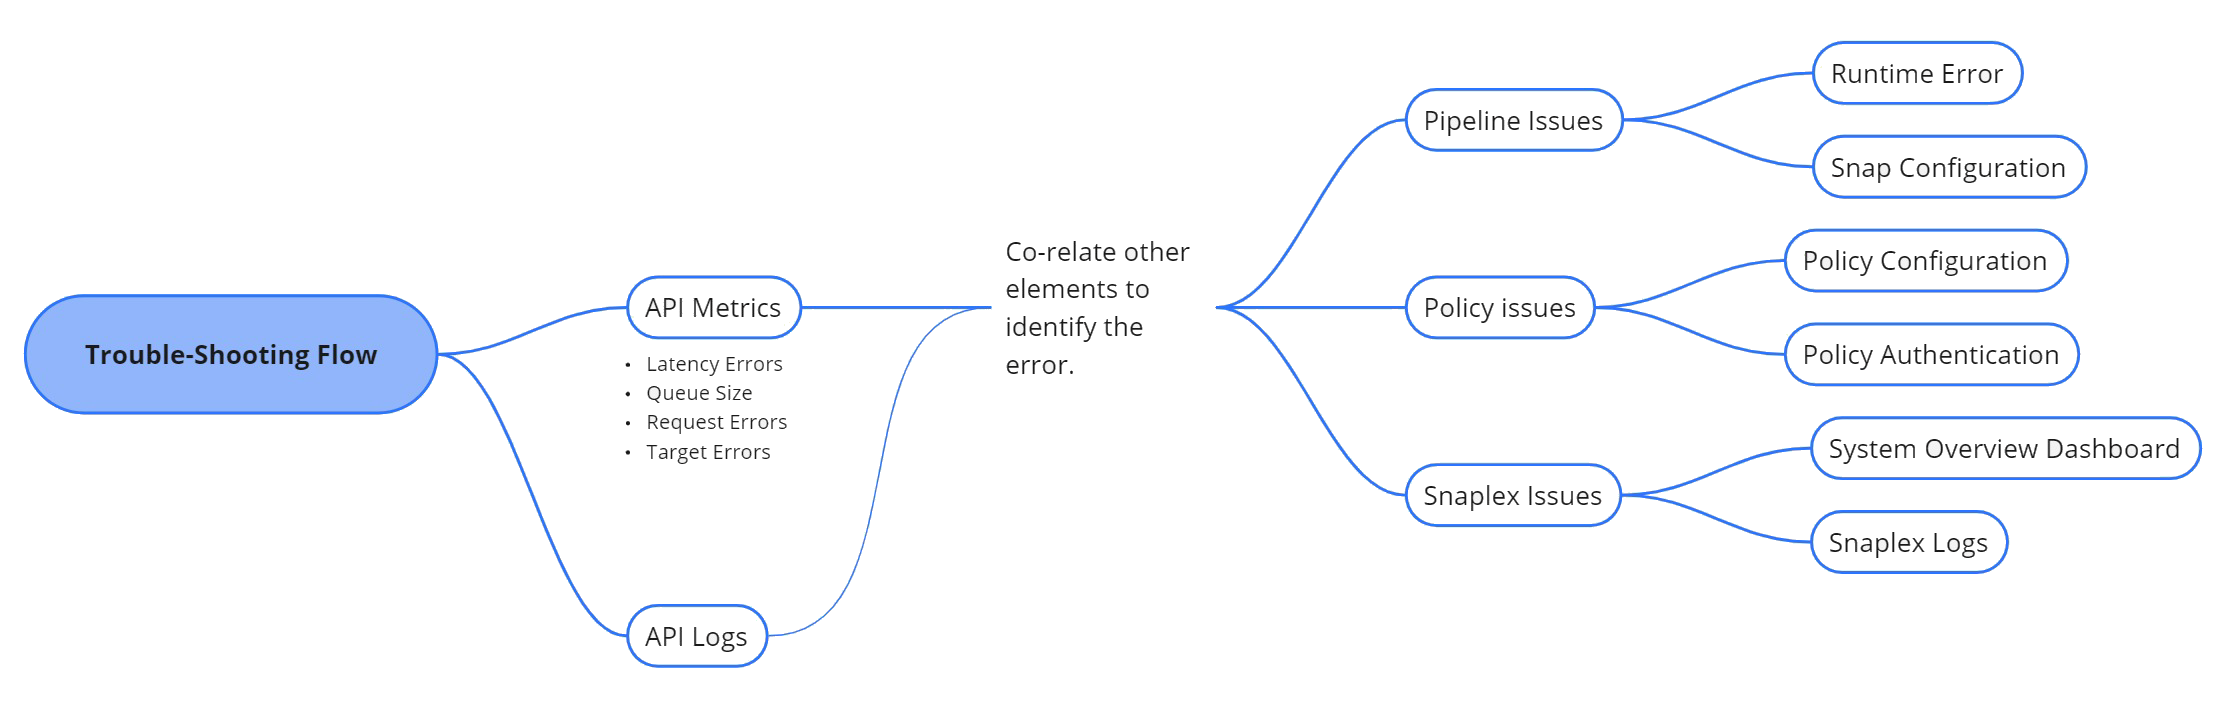
The separation of response and target errors on the API metrics page helps pinpoint where the error occurred. Response errors can come from issues with pipeline, Snap, or Policy configuration. Target errors can come from the Pipeline runtime, the Snaplex, or a third-party proxy. The following image illustrates the troubleshooting flow:
API metric graphs
API metrics graphs help you visualize metrics for API consumption. Correlate the following metrics to track and troubleshoot errors:
- The request, queue size and error percentage graphs: To identify the error, narrow down the timeframe from the requests. Then, use the Error Percentage graph to understand the issue, which could be due to ineffective API design, poor documentation, or malicious actors. If Ultra Tasks are involved and there's a spike in request wait time, analyze the Queue Size graph. Co-relating these metrics provides a high-level view of the error flow, which can be further refined with other metrics.
- Request errors, target errors and latency spike: Request errors in the 4xx to 5xx range typically result from API policy violations or authentication failures, causing requests to be canceled. Target errors in the 4xx to 5xx range are often related to pipeline state or runtime conditions. By correlating latency spikes with target errors, you can determine whether the pipeline error occurs before or after execution. Similarly, correlating latency spikes with request errors helps clarify whether the issue is related to policy configuration, post-policy execution, or authentication.
API logs
The Retrieve API Management Logs
API can help narrow down errors related to the pipeline or policy. Check response body attributes such
as request_status_code, target_status_code,
auth_type, which help identify error types or authentication issues. The
cc_id and invoker_snode attributes provide information about the
Snaplex node, allowing you to identify the Triggered Task or Ultra Task that generated the log
entry.
To locate the time of the error, check theprocessing_time,
request_time, request_processing_end_timeattributes. For
Ultra Tasks, you can gather additional time-frame details using
therecv_time, start_timereply_time
attributes from the response body.
Pipeline issues
Pipeline errors can occur for various reasons and at different stages of pipeline execution. Commonly, pipeline issues fall into the following categories:
- Runtime error: Runtime errors occur during pipeline execution. These errors can result from incorrect pipeline configuration, invalid input data, resource or permission restrictions, timeouts, memory limits, or version conflicts. You can gain more insights into pipeline execution by retrieving information about a task.
- Snap configuration error: Invalid Snap configuration results in errors. Snap configuration issues can arise due to invalid input data, permission restrictions, missing required fields, or inconsistent data schemas. External JAR files or library version mismatches can also cause execution failures. To troubleshoot these errors, refer to the Pipeline issues in Troubleshooting page.
Policy issues
- Policy configuration error: These errors occur when policy settings are incorrect
or improperly defined. To troubleshoot these errors, follow these steps:
-
Check Permissions or Access Control:
- Ensure that the user or application has been granted the necessary roles or permissions.
- Review the policy settings, to verify that they allow the required actions.
- Avoid overly restrictive access that may block necessary operations.
- Review policy changes:
- Ensure that any recent updates or changes to policies are correctly propagated across your system.
- Ensure policy hierarchy or priority is enforced correctly. One policy may allow an action while another denies it, so confirm that policies are aligned and do not conflict.
-
- Policy authentication error: These errors occur when there’s an issue with
verifying the identity of a user or service, often related to authentication mechanisms.
- Validate API Keys, Tokens, or Credentials:
- If using OAuth, check whether the token is expired or invalid and refresh the token if necessary.
- Ensure the correct authentication method is used for the specific API or API ecosystem
- Debug the Authentication flow:
- Verify whether the user or application has the appropriate roles and permissions assigned for the operation.
- Review any status code in the response body. For example, a
401
                    Unauthorized
status indicates an authorization error, and a403 Forbiddenstatus indicates access issues.
- Validate API Keys, Tokens, or Credentials:
Snaplex issues
For Snaplex issues, check the Monitor > Infrastructure > System Overview dashboard. This dashboard provides details such as CPU usage, disk usage, pipeline executions, alerts, and activity logs.To investigate further, you can request Snaplex logs from your Customer Success Manager (CSM) to identify the root cause of the error.
Learn more about the Infrastructure dashboard
Requests not displaying on the API metrics page
If you know APIs or Ultra Tasks are running, but not showing up on the API metrics page, ensure that the underlying pipeline has an output view that returns a response to the client. This is the only way that the system can gather metrics from it.