


Analyze and manage Snaplexes
Use the Infrastructure page to:
View Snaplex details
From the Infrastructure Graphs or Snaplexes view, click a Snaplex to open the details panel. Snaplex details include information on the Snaplex and its nodes:
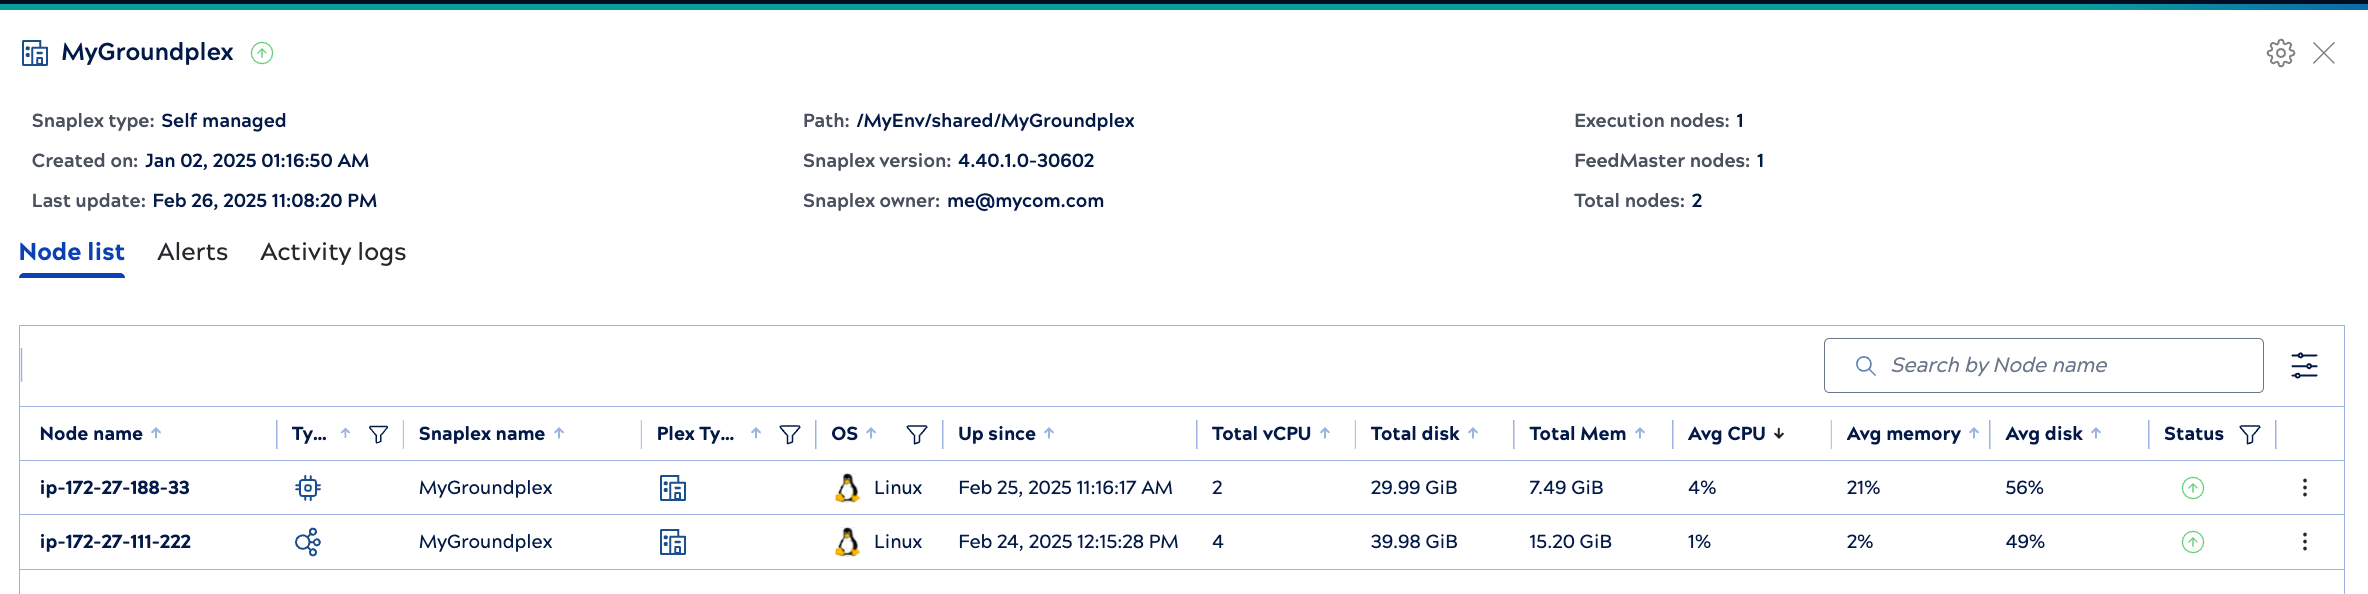
In the details panel:
- Click a node to view its details.
- The Alerts tab shows node alerts such as failures to communicate with other nodes.
- The Activity logs tab reports Snaplex activities, such as when a node is added or removed.
- For self-managed Snaplexes, Org admins can click the gear icon to start or restart Snaplex nodes.
Find a node by its status
To find nodes by their status:
- In the graph view, click
 in the search box to open advanced filters. Select one or more node statuses.
 - In the table view do one of the following:
- Click the filter icon in the Status field and select one or more of the
active or inactive states:
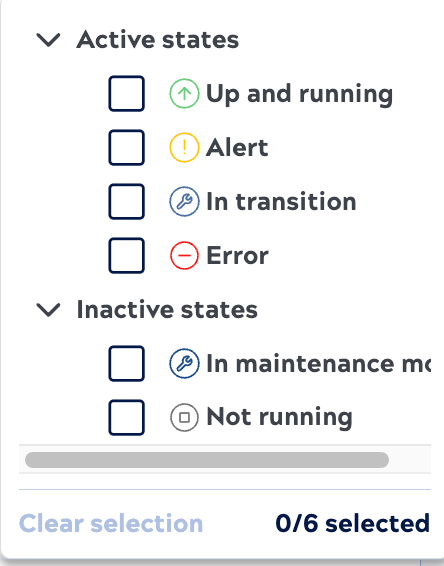
- Click to open the Table configuration and filters dialog. From the
Status field, select one or more of the active or inactive states.
- Click the filter icon in the Status field and select one or more of the
active or inactive states:
Restart Groundplex nodes
Org admins can restart self-managed Groundplex nodes from the Infrastructure page. When stopped or restarted, Snaplex nodes attempt to complete any running pipelines and stop accepting requests. Snaplex state transitions provides more details.
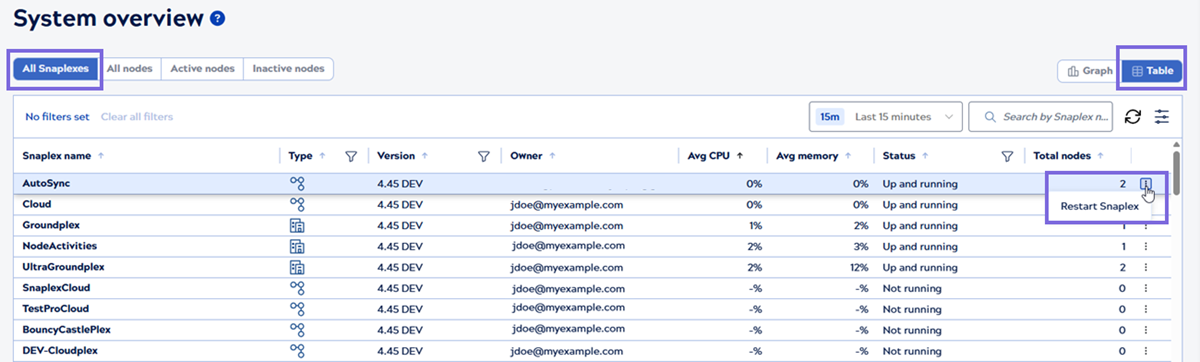
- Navigate to Infrastructure in the left navigation pane. By default, the Snaplexes tab is displayed.
- Click the three dots at the end of the row.
- Click Restart Snaplex.
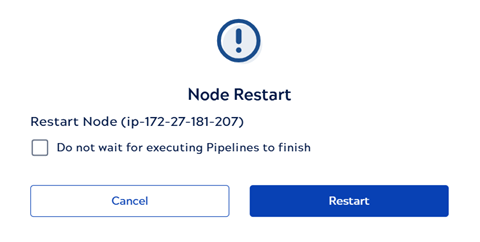
 The following confirmation dialog displays.
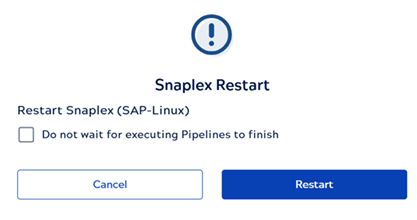
The Do not wait for executing Pipelines to finish checkbox is not selected by default. Hence, the Platform waits for running pipelines to complete before restarting (within the maximum timeout window). To restart the Snaplex immediately, select this checkbox and click Restart.
-
In the Infrastructure page, click the Snaplex to restart.
The Snaplex details panel displays.
-
Click the gear icon on the top-right.
-
Click Restart Snaplex. A confirmation dialog displays.
The Do not wait for executing Pipelines to finish checkbox is not selected by default. Hence, the Platform waits for running pipelines to complete before restarting (within the maximum timeout window). To restart the Snaplex immediately, select this checkbox and click Restart.
![]()
- Click the Nodes tab. By default, the Active nodes tab is selected.
- Click the three dots at the end of the row.
- Click Restart node.
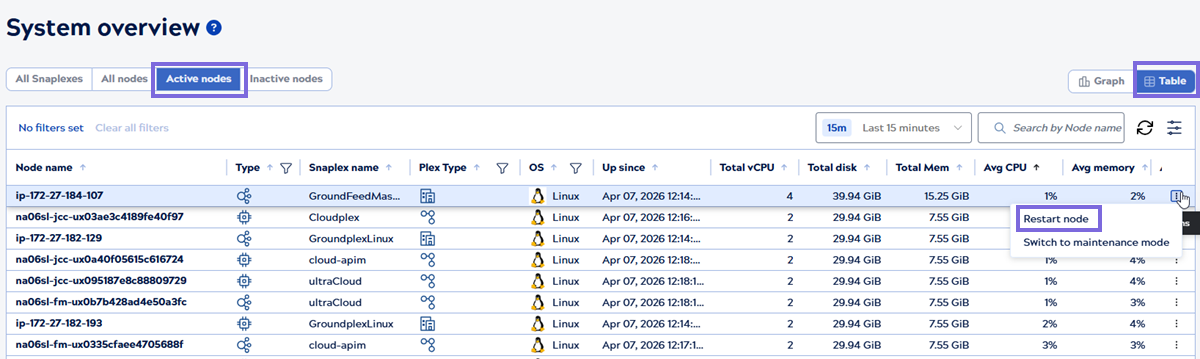
The Do not wait for executing Pipelines to finish checkbox is not selected by default. If pipelines are running, the node waits until the amount of time configured in the Max. restart wait time value in the Node properties is reached before restarting. To restart the node immediately, select this checkbox and click Restart.
- On the Infrastructure page, click the Nodes, and then the Active nodes tab.
-
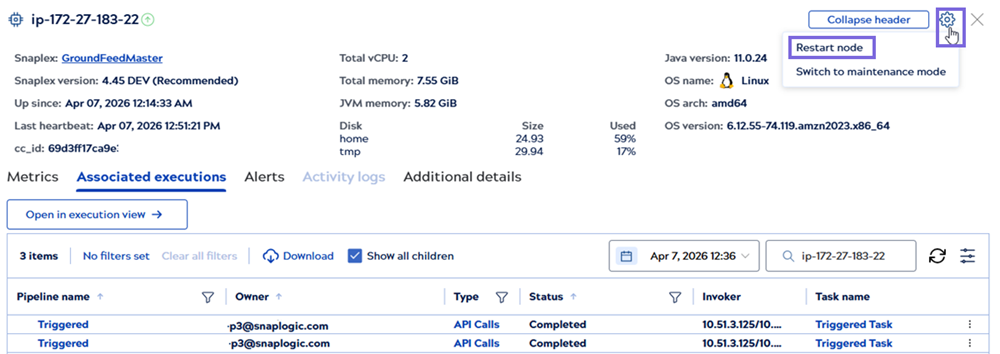
Click the node to restart.
-
Click the gear icon on the top-right.
-
Click Restart node. A confirmation dialog displays.
The Do not wait for executing Pipelines to finish checkbox is not selected by default. If pipelines are running, the node waits until the amount of time configured in the Max. restart wait time value in the Node properties is reached before restarting. To restart the node immediately, select this checkbox and click Restart.
View the mean execution time for Ultra Tasks
FeedMaster node details include the mean execution time for the last 1000 requests handled by active Ultra Tasks. To view the execution time from Monitor, follow these steps:
- In the Nodes or Graphs view, go to Active nodes, locate the node on which the task is executing and click it to view its details.
- Click the In progress requests tab and view the Execution
time column.
Note: The In progress requests tab is available for FeedMaster nodes only.
View offline nodes
Nodes in a Snaplex send a heartbeat every 20 seconds to the control plane to indicate they're active. Nodes that don't send a heartbeat for 15 minutes are marked as inactive. Nodes without a heartbeat disappear from the Infrastructure after 15 minutes. Change the time period to view nodes that went offline.
Inactive nodes have a dash instead of values for Avg CPU, Avg Memory and Avg Disk Utilization.