Agent Visualizer
The Agent Visualizer Snap provides a comprehensive dual-view interface combining an interactive Diagram and a detailed step-by-step Log. This dual visualization approach enables users to trace and analyze agent behavior precisely, offering enhanced transparency into complex AI agent operations and making it easier to understand how agents process and respond to user requests.
Getting Started with AgentVisualizer
Where to find the Agent Visualizer Snap
The Agent Visualizer Snap is available via the AgentCreator Experimental (Beta) Snap Pack. To locate the Snap, type in the first few letters of the Snap name into the Snap Catalog field. When the Snap appears in the listed Snaps, drag it to the Designer canvas.
Run Agent Visualizer
Prerequisites: Your pipelines need to validate successfully to display the Diagram and Log.
- Connect the Agent Visualizer Snap after the Pipe Loop Snap in your Agent driver pipeline.
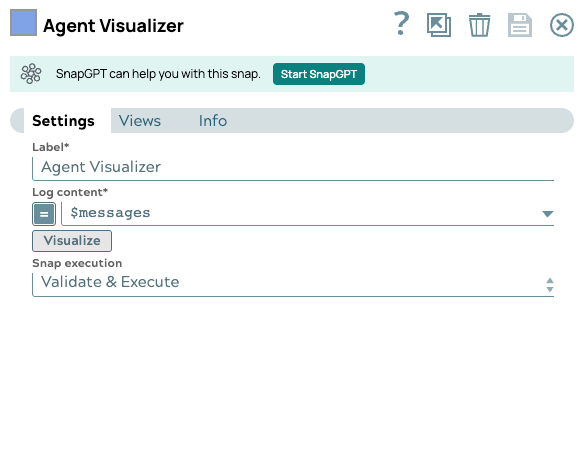
- Point and click the Agent Visualizer Snap to open the Settings dialog.
- In the Log Content field, enter the string $messages.
- Click Save, then close the Snap and validate the driver pipeline.
- When pipeline validation is complete, reopen the Settings dialog, and click the Visualize button.

The Agent Visualizer Snap has two output views. The first output view passes through the data from the Agent, and the second output contains the data to render the visualization. You do not need to add any Snaps to either view.
Understanding the Diagram and Log
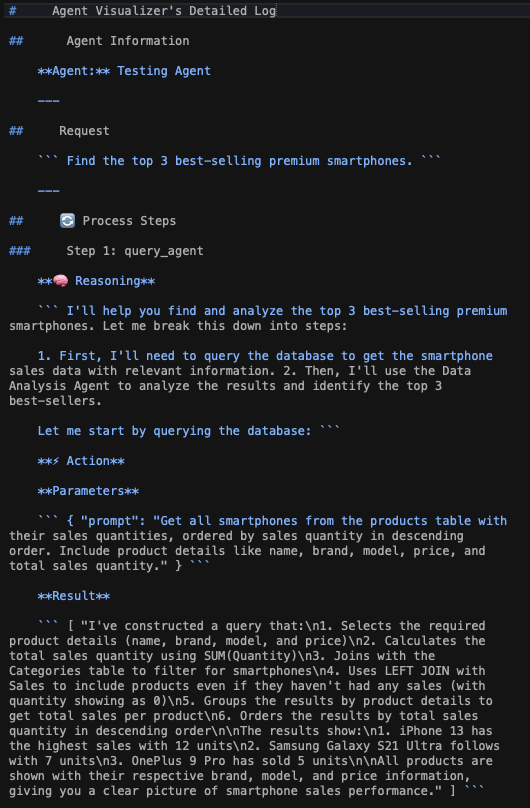
On the left side, the Agent Visualization Diagram shows the relationship between your Agent driver, worker, and tool pipelines. On the right side, the Detailed Log records the interaction between the prompt and Agent pipeline processing into the Request and Actions panes.
- REQUEST: Displays the user prompt
- REASONING: Shows the logical process of the agent for the following action.
- ACTION: Tracks the information for each invoked tool.
- PARAMETERS: Displays the corresponding parameters for the current tool.
- RESULT: Displays the execution result of the tool.
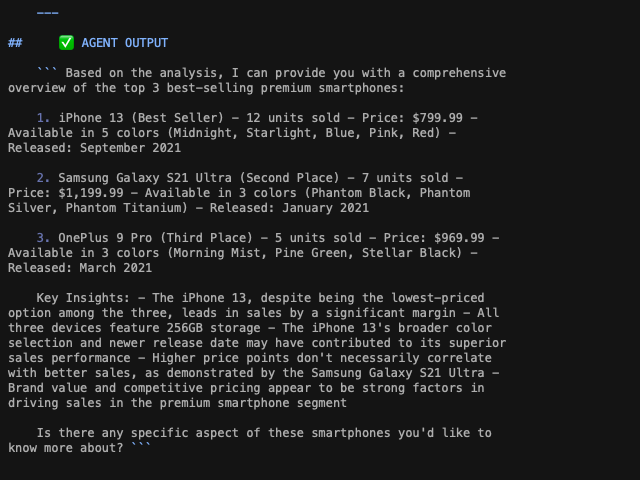
- AGENT OUTPUT: The response to the user prompt.
Explore the Interface
The interactive relationship between the Diagram and Log interface facilitates understanding and debugging the interaction between the prompt and the Agent response.
- Click the box containing the agent name (which is the Agent driver pipeline name) to navigate to the user prompt.
- Click the box of each step in the Diagram panel to navigate to the associated part on the Detailed Log panel.
- Click Agent Output takes you the final response from the LLM.
Summary of Agent Visualizer functionality
- Parses both single and multi-layered agents: Agent Visualizer Snap can parse not only the single-layer agents but also agents with nested agents to generate corresponding diagrams and logs.
- Supports multiple LLM providers: Agent Visualizer Snap can visualize agents built by either OpenAI or AWS Bedrock, or a mixture of both providers.
- Visualizes agent performing parallel tool calling: Agent Visualizer Snap can identify and display when agents are calling multiple tools at the same step.
For example, if an Agent calls two tools simultaneously in Step 1, then the step numbers of the two tools are Step 1-1 and Step 1-2. The sub-steps to the two tools would be Step 1-1.1 and Step 1-2.1, respectively.
- Magnification: you can either drag the slider or click on the + and - buttons on each side of the slider to zoom in or out of the Diagram.
- Header: The header displays the
Snap name | pipeline name(such as,Agent Visualizer | E-Commerce DB Agent). - Hover highlight: In the Diagram panel, when you hover the mouse over any label. Both the box and the associated label are highlighted.
- Click-to-select: In the Diagram panel, when you click on any label or box, both the box and the associated label are highlighted. In addition, the Detailed Log panel automatically scrolls to the corresponding Log position, and the related text and boxes are highlighted.
- The X icon: Click to close the intertface.
- The Done button: Click to close the interface.
- The Refresh icon: Click to navigate to the top of the Diagram.
- The
 icon: Click to download the Agent Visualizer log in Markdown format.
The following images show portions of the Markdown file of the Agent.