


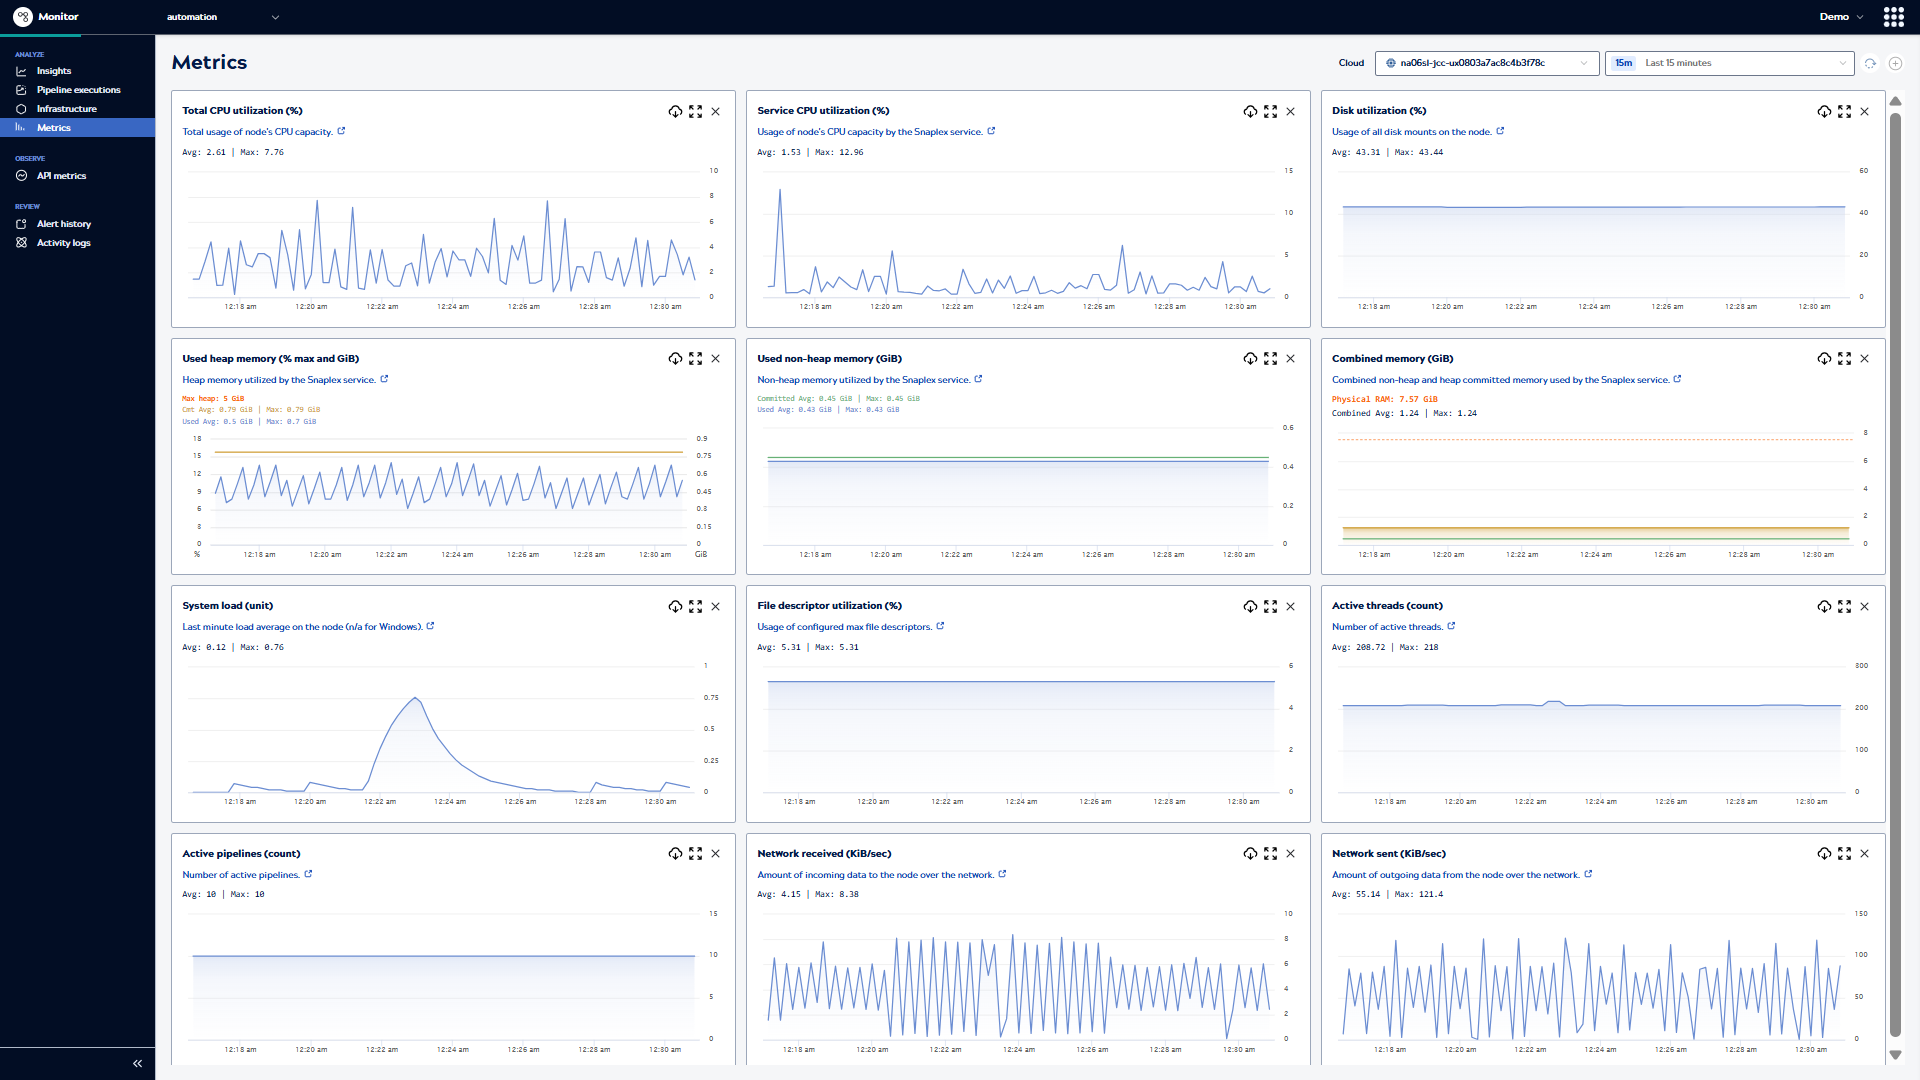
Work with Metrics graphs
The default Metrics page layout includes twelve graphs. Click ![]() next to the Download and Expand icon to remove a graph. Click
next to the Download and Expand icon to remove a graph. Click ![]() on the top right of the page and select a chart to add a graph back.
on the top right of the page and select a chart to add a graph back.
View data point values
In a regular or an expanded graph:
- Hover over a line to view the values for a specific time above the plot.
- Click and drag to zoom in on a shorter time period. Click Reset zoom on the left side of the chart to return to the original time range.
Find executions and download pipeline logs
When a graph indicates high resource use, you can find the executions that ran at that time:
- Click
 to expand the graph.
 - Drag the cursor to zoom into a smaller time period. A table of the pipelines that ran at that time displays below the graph.
- Click
 to download a log of the metric data for the selected time period in .csv
format. The log includes the time, node name, and metric value. Important: Timestamps in the downloaded files represent Coordinated Universal Time (UTC), not local time.
to download a log of the metric data for the selected time period in .csv
format. The log includes the time, node name, and metric value. Important: Timestamps in the downloaded files represent Coordinated Universal Time (UTC), not local time. - Optionally:
- View the execution record by clicking Open in execution view.
Tip: Scroll to the Execution history table.
- Open the pipeline in Designer by clicking the pipeline name.
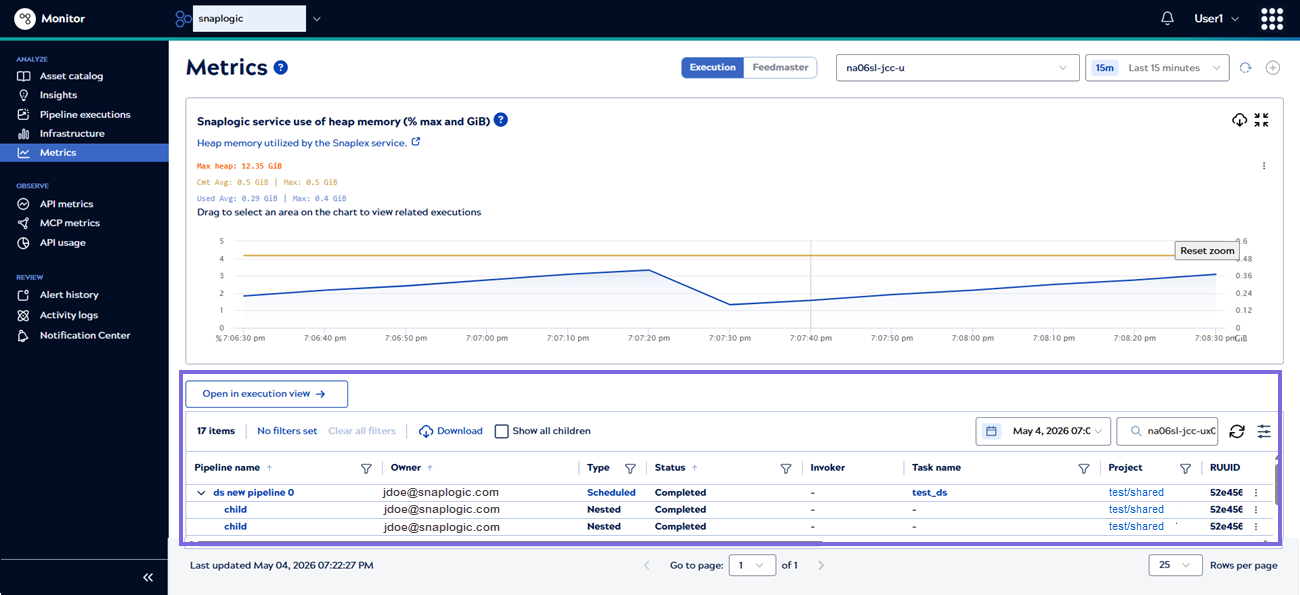
- View the execution record by clicking Open in execution view.
Page controls reference
The following table describes the actions available from the Metrics page:
| Action | Available from |
|---|---|
| Select a node or multiple nodes | Page toolbar |
| Change the time period | Page toolbar |
| Refresh graph data | Page toolbar |
| Add a chart that was removed | Page toolbar |
| Expand or remove a chart | Default layout |
| Collapse the graph to normal size | Expanded chart |
| Download graph data | Default layout, Expanded chart |
| View individual data point values | Default layout, Expanded chart |
| Zoom in | Default layout, Expanded chart |
| Display pipeline executions and open them on the Pipeline executions page | Expanded chart |