


Example—Error pipeline
Example of an Error pipeline.
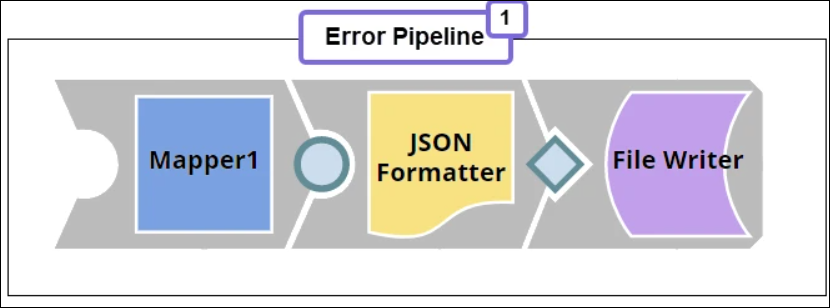
Create an error pipeline
-
Create a pipeline containing the Mapper,
JSON
Formatter, and
File Writer
Snaps.
-
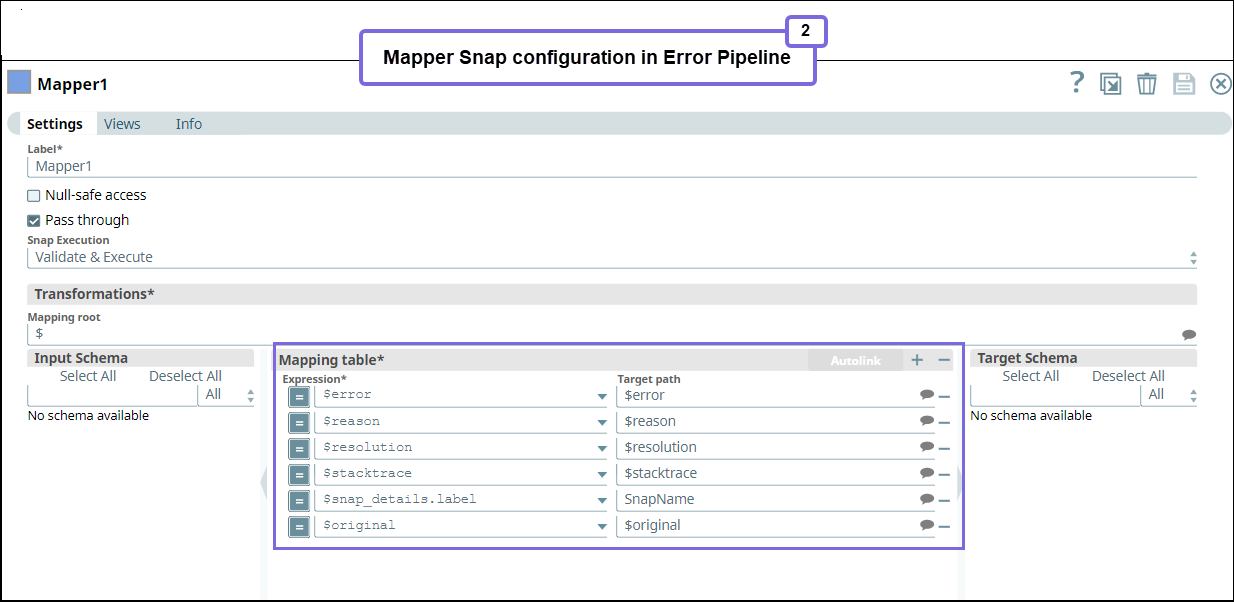
Configure the Mapper Snap to gather data
from the main pipeline.
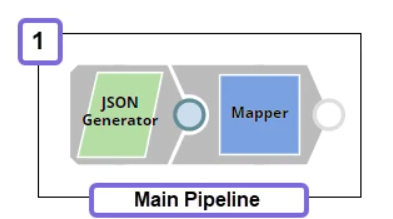
Create the main pipeline
-
Create a simple pipeline containing the JSON Generator and Mapper Snaps.
-
Configure the JSON Generator Snap with the message
Hello Worldand number1.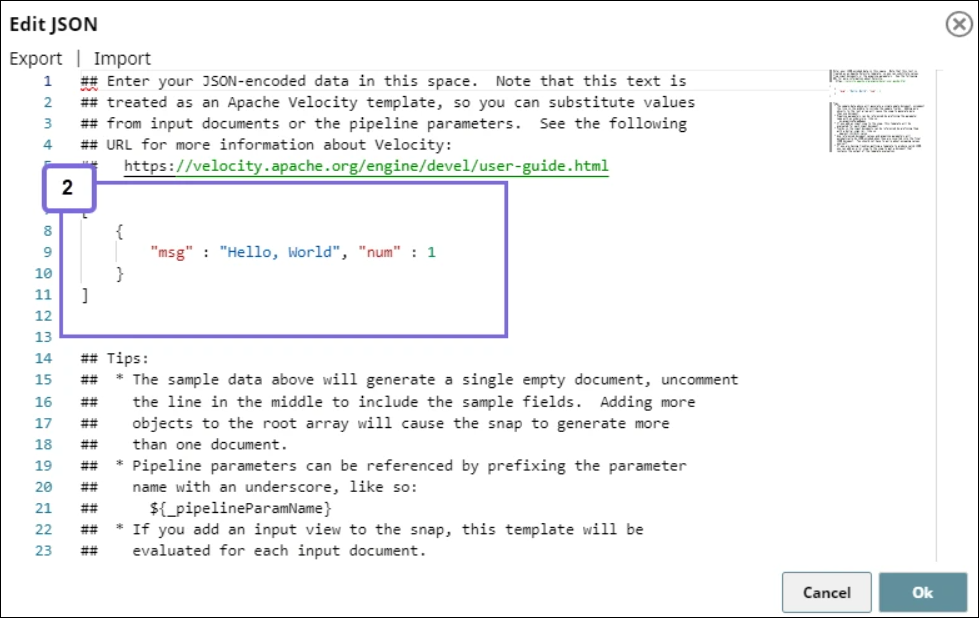
-
Configure the Mapper pipeline as follows. Specify
$statusin the Mapping table.There is no
statusobject in the input data, hence the Snap results in an error.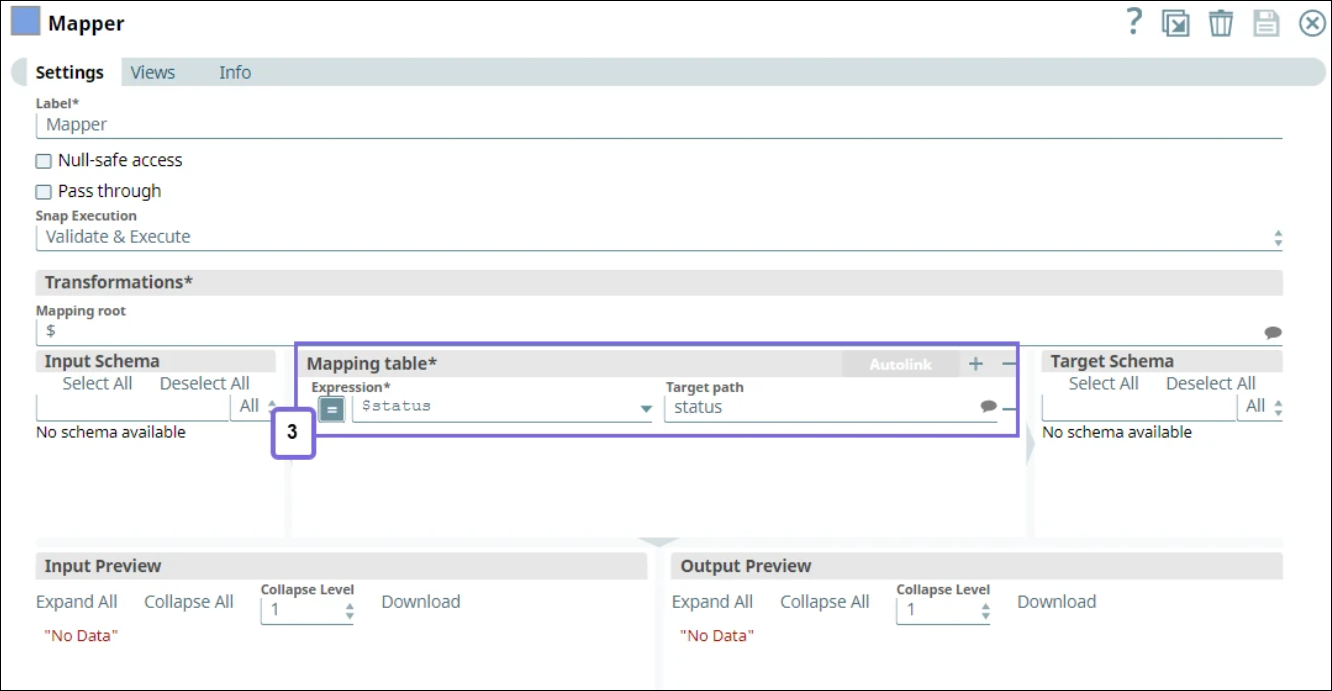
Set the Snap to Route to Error Pipeline under the Views tab.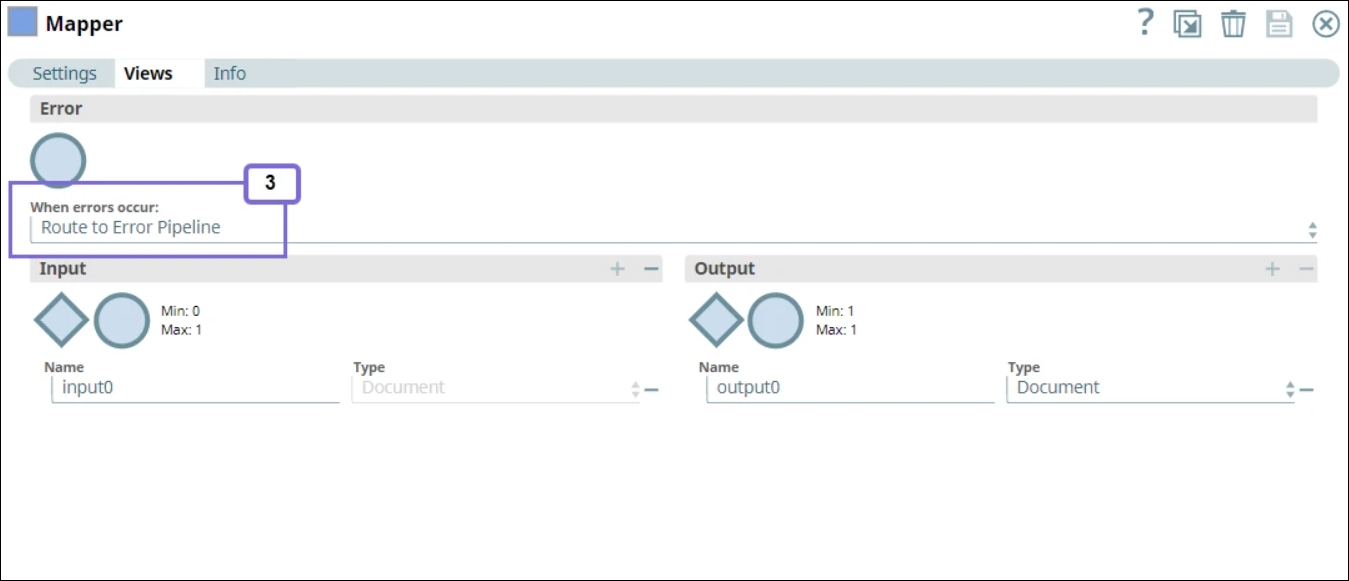
-
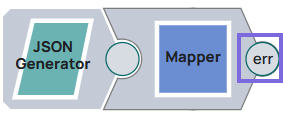
Right-click the Mapper Snap’s context menu and select, Link Output to Error
Pipeline. You can see
errin the Mapper connector.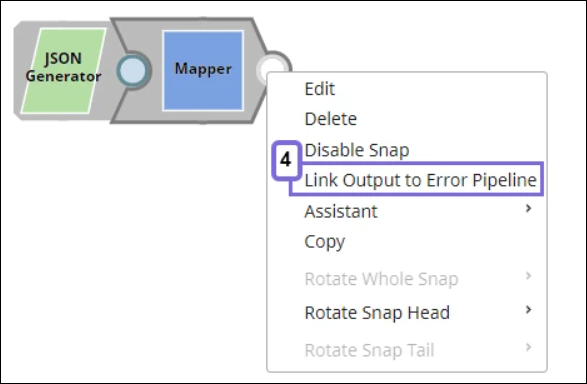
-
Click the Properties
 icon in
the Designer toolbar, and select the Error Pipeline that you want to link.
icon in
the Designer toolbar, and select the Error Pipeline that you want to link.