


Run Snaplex diagnostics
Steps to run Snaplex diagnostics
- Admin access to the Groundplex host machine.
- Ensure that you have the necessary permissions to execute commands on the host machine.
- Log into the Groundplex host machine.
-
Navigate to the
/opt/snaplogic/bindirectory. -
Depending on your host operating system, use one of the following commands to start the diagnostic utility on the Snaplogic node:
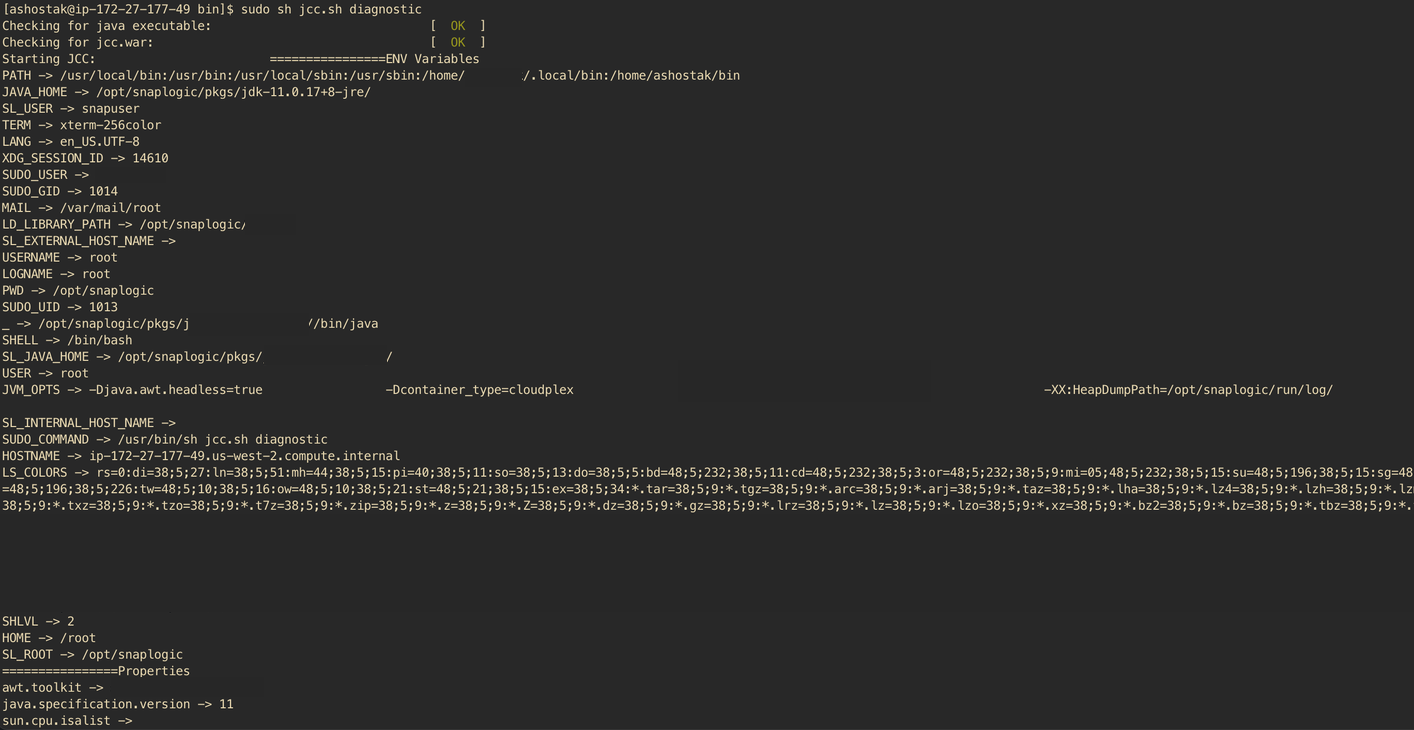
- Linux:
./jcc.sh diagnostic - Windows:
jcc.bat diagnosticAs the diagnostic utility starts, the following message appears: Starting Snaplogic Snaplex in diagnostics mode
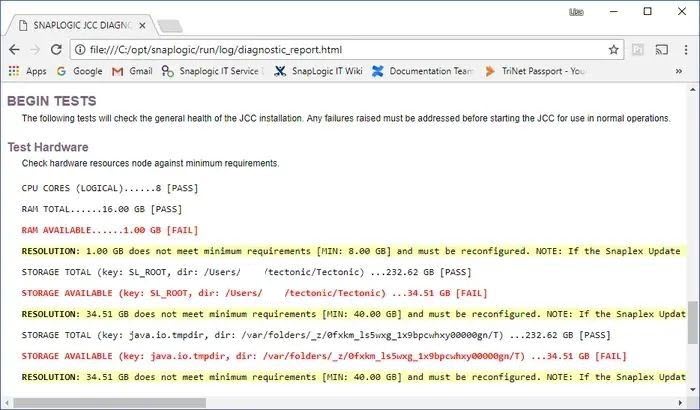
In a few minutes, when the report is complete, the following message appears: A diagnostic report has been generated at: C:\opt\snaplogic\run\log\diagnostic_report.html
-
For the Linux environment, the diagnostic report is embedded into the terminal. Use the SCP command in the Linux environment to view the report page from your local machine. Refer to file for detailed information: Diagnostic report.html
-
In the Windows environment, open the report in a web browser to see if there are any issues. For example:
- Linux:
The diagnostic report checks the following criteria:
| Diagnostic test | Recommended value | Examples of current value displayed in the diagnostic test |
|---|---|---|
| Nodes have insufficient swap space | If the maximum value is not present, the system displays the value of 50% of the RAM configured or 8 GB, whichever is greater. |
If the value is not as per the recommended value the current value is displayed in red. Example: 1 GiB |
| Max Slots | If there is no minimum value, then the recommended value is calculated as follows: RAM configured or 2000 (max value) per 8 GB of RAM rounded to the nearest 500. | Example: If the maximum value is 3840, the current value displayed is 4000 |
| Thread limit | Minimum value = 65000 |
Displays the thread limit in red if the value is below the recommended value. Example: 4000 |
| Max file descriptors | If there is no maximum value and the minimum value is 65000, then the recommended value should be 65000. | Example: 65535 |
| Max jvm heap |
The minimum and the recommended value is calculated as follows: RAM configured *.85 Minimum value = 12 GiB Recommended value = 12 GiB |
Example: 12.44 GiB |
| RAM configured |
Minimum value = 4 GiB Recommended value = 4 GiB |
Example: 16.32 GiB |
| RAM available | More than 15 minute period per day where memory utilization is > 75% or average memory utilization is > 60% | Example: 2.78% |
| Disk storage configured |
Minimum value: 40 GiB Recommended value: 100 GiB |
Example: 39.98 GiB |