Snaplex execution flow

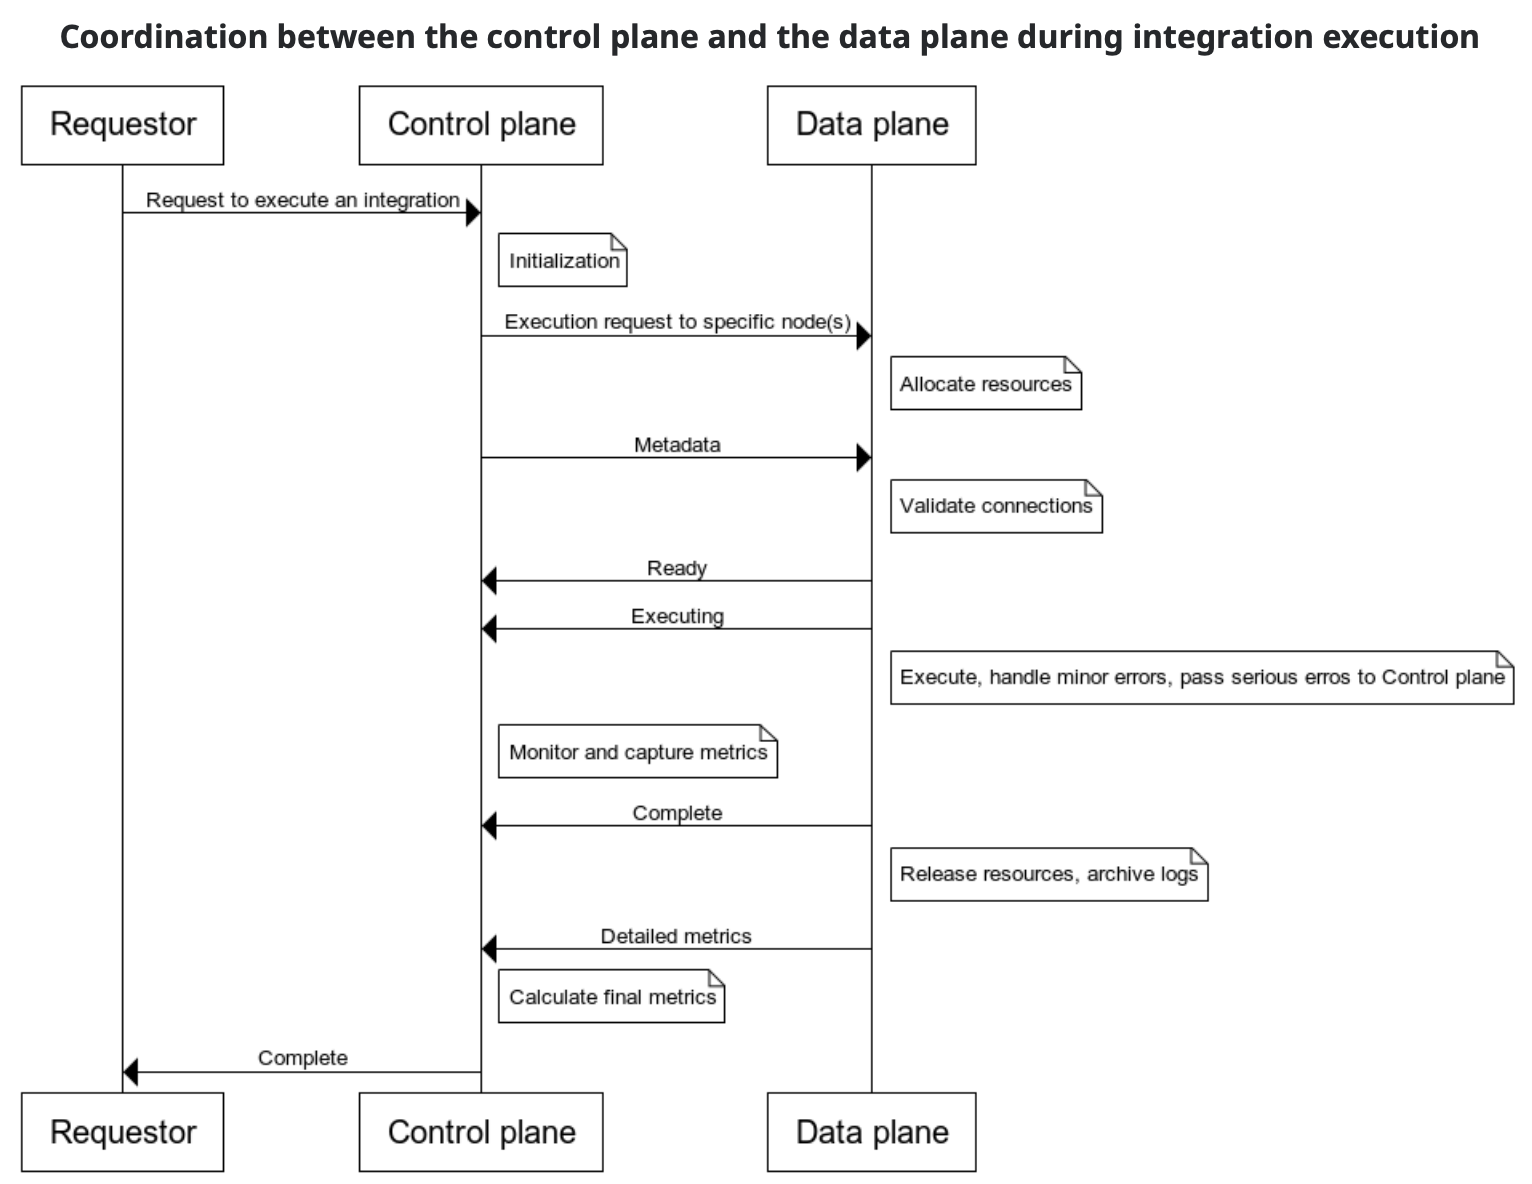
The control plane and the data plane, introduced in the Platform overview, orchestrate the efficient processing of data across diverse business systems. The following diagram shows interactions between the control plane and the data plane during integration execution.


You can observe the information generated by the Snaplex nodes and the control plane in Monitor:

  • In the Execution overview, click an execution to open the details. Learn more.
  • The Snap Statistics tab shows a breakdown by Snap for the amount of documents processed. Hover over a Snap to see metrics such as the allocated memory and a breakdown of the amount of time each Snap took to complete its work. Learn more.
  • The State Transition tab records timestamps at the start of each stage of execution, from preparation to completion. Learn more.

The following table correlates the initialization, preparation, execution, and completion stages of integration execution with the work performed by the control plane and Snaplex nodes.

Table 1. Stages of pipeline execution
Stage Control plane Snaplex nodes
Initialization
  • Receives execution request from the requestor.
  • Identifies the relevant pipeline(s) based on the execution request.
  • Assigns specific pipeline tasks to Snaplex nodes based on their availability and capabilities.
  • Receive execution request from control plane.
  • Allocate memory and processing resources to prepare the environment.
Preparation
  • Accesses pipeline metadata to retrieve the required preparatory information.
  • Performs validation and authorization checks to make sure that execution adheres to defined security and access controls.
  • Establish connections to relevant endpoints. This includes connecting to databases, APIs, and file systems.
  • Check to validate that the environment is ready and that all prerequisites are met.
  • Communicate readiness and initialization status back to the control plane.
Execution
  • Loads pipeline metadata into its runtime environment.
  • Monitors the progress of pipeline execution.
  • Captures relevant metrics for auditing, troubleshooting, and performance analysis.
  • Based on the real-time communication from the snaplex nodes, manages errors either by predefined error-handling logic or by stopping the pipeline when required.
  • Execute the assigned tasks in parallel to optimize performance and handle large volumes of data efficiently.
  • Handle errors locally by trying to resolve them before sending them to the control plane.
Completion
  • Logs error messages and timestamps.
  • Calculates total output of each Snap and transformed data generated by Snaplex nodes.
  • Provides a final status report with the status of the pipeline execution and relevant performance metrics.
  • Release allocated compute resources, closes open connections, and cleans up temporary files.
  • Send comprehensive metrics to the control plane for analysis and optimization.
  • Archive detailed execution logs.