


View pipeline details
View execution details, Snap statistics, and logs for a pipeline run.
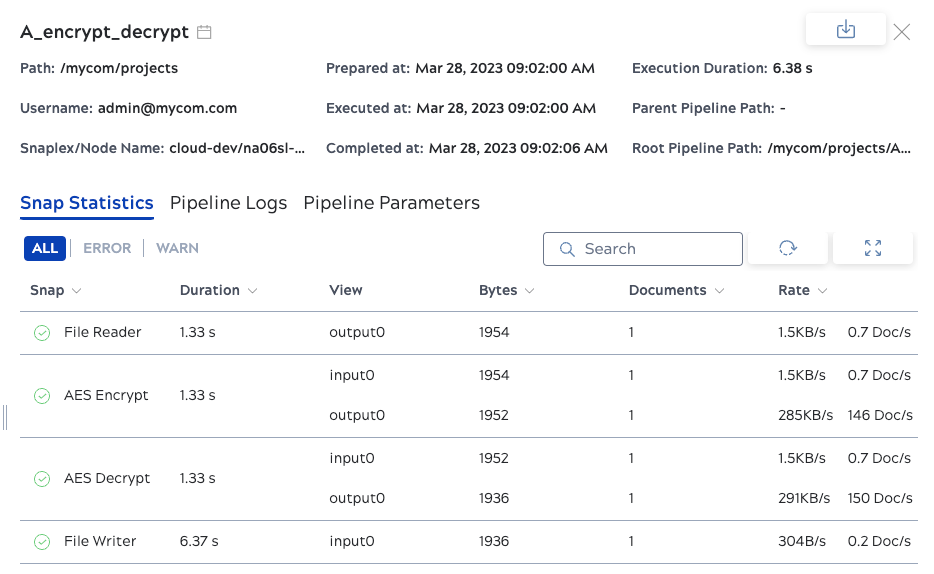
In the Pipeline executions table, click a pipeline name to open it in Designer. Click anywhere in a pipeline execution row, except the pipeline name, to open the execution details panel. Panel tabs include: Snap statistics, Children (only for parent pipelines), Pipeline logs, Pipeline parameters, and State transition. Snap statistics also show in Designer when developers validate and run pipelines.
The following sections describe the panel header for:
Normal execution header
The details panel header provides information about the pipeline and the task that invoked it:
From the header:
- Click Open in Designer to view or edit the pipeline.
- Click the Task link to open the task details.
- Click Collapse header to hide the header.
- Click Expand header to show the header.
- Click Download
 to download pipeline details. Download logs
only exports the Pipeline logs tab content as a JSON file.
Download full runtime dump exports all runtime data, including
Snap statistics, logs, pipeline parameters, and state transition.
to download pipeline details. Download logs
only exports the Pipeline logs tab content as a JSON file.
Download full runtime dump exports all runtime data, including
Snap statistics, logs, pipeline parameters, and state transition.
The following table describes the pipeline details header fields from left to right and top to bottom:
| Field | Description |
|---|---|
| Icon after the pipeline name | Indicates the type of task that executed the pipeline: 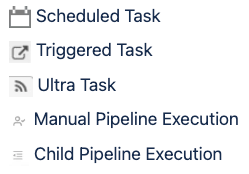 |
| Path | The environment name, project space, and project name. |
| Prepared at | The time the pipeline transitioned to the Prepared state, meaning resources were allocated and the pipeline was ready to execute. The gap between this and Executed at is the preparation time. |
| Execution duration | The time the pipeline required to complete, not including preparation time. |
| Owner | Usually the user that created the integration. Ownership can be transferred, for example, when a user is removed from the environment. |
| Executed at | The time pipeline execution started. |
| Invoker | For Triggered Task executions or manual runs of AutoSync data pipelines, this field includes the IP address or user ID of the invoker. |
| Snaplex/node name | The Snaplex node that ran the pipeline. |
| Completed at | The time the pipeline finished. |
| Parent pipeline path | For child pipelines, the path to the parent. The path includes the project space name, project name, and pipeline name. |
| Task name | The task that initiated the pipeline run. |
| Slot | Snaplex nodes are configured with a maximum number of slots, or allocated memory spaces. Each Snap uses a slot to execute. This is the count of the number of slots used by the pipeline. |
| Resumable | Resumable pipelines are a subscription feature. If this field shows Yes, you can resume a suspended pipeline by clicking the three-dot menu in its execution row and selecting Resume pipeline. |
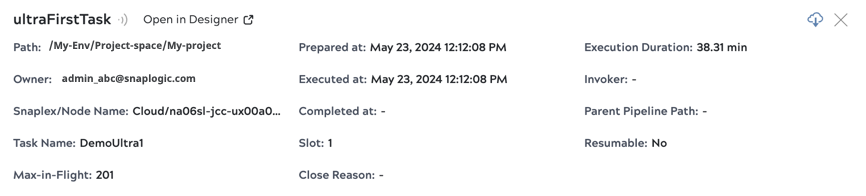
Ultra execution header
Two fields specific to Ultra Task executions:
- Max-in-flight: The threshold for the number of documents a single node processes. Once the execution reaches the threshold, the Snaplex distributes requests to other nodes. The threshold value is set in Ultra Task configuration settings.
- Close reason: When an Ultra Task transitions to the completed
status, the close reason can be one of the following:
- Reference no longer exists or is inaccessible
- Host Snaplex node restarted
- The Ultra task has been updated
- The task is no longer active
- Closing Ultra pipeline instance to balance instances across the Snaplex
Ultra executions also include the Ultra requests tab in the details panel.
The following pages describe the tabs on the pipeline details panel:
- Snap statistics tab
- Children tab (parent pipelines only)
- Pipeline logs tab
- Pipeline parameters tab
- State transition tab
- Ultra requests tab (Ultra Task executions only)