


Monitor
Use SnapLogic Monitor to check Snaplex health and monitor pipeline execution.
The SnapLogic Platform enables your organization to integrate, orchestrate, and transform data from a variety of sources, including relational databases, applications, and files. Monitor provides visibility into integration executions, activities, events, and infrastructure health in your SnapLogic environment.
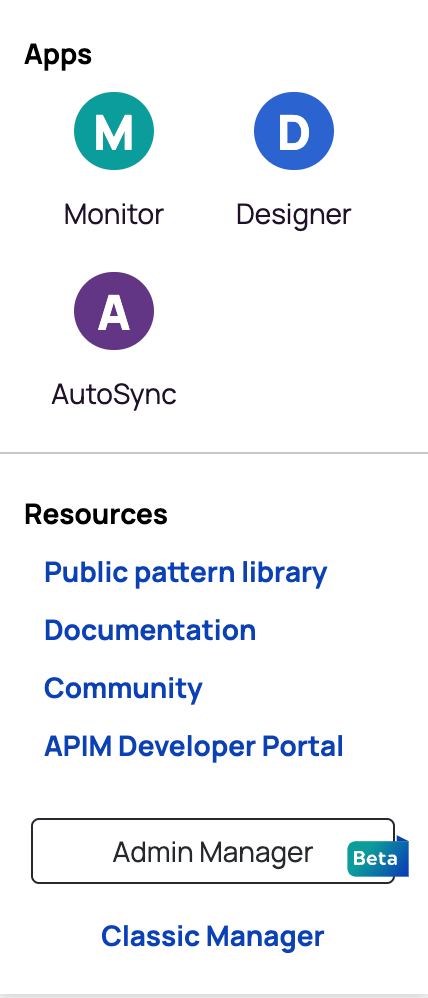
Open Monitor from the Mission Control section of the waffle menu:
Monitor pages include:
-
The Asset catalog summarizes metadata for all operational pipelines, tasks, and accounts. When enabled in an environment, by default the Asset catalog is visible to everyone. Non-admins can only view assets they have at least read access to. On the Admin Manager Asset catalog page, Environment admins can restrict Asset catalog visibility to Environment admins only.
- Insights—A summary of users, sessions, pipelines, Snaps, documents processed, and more.
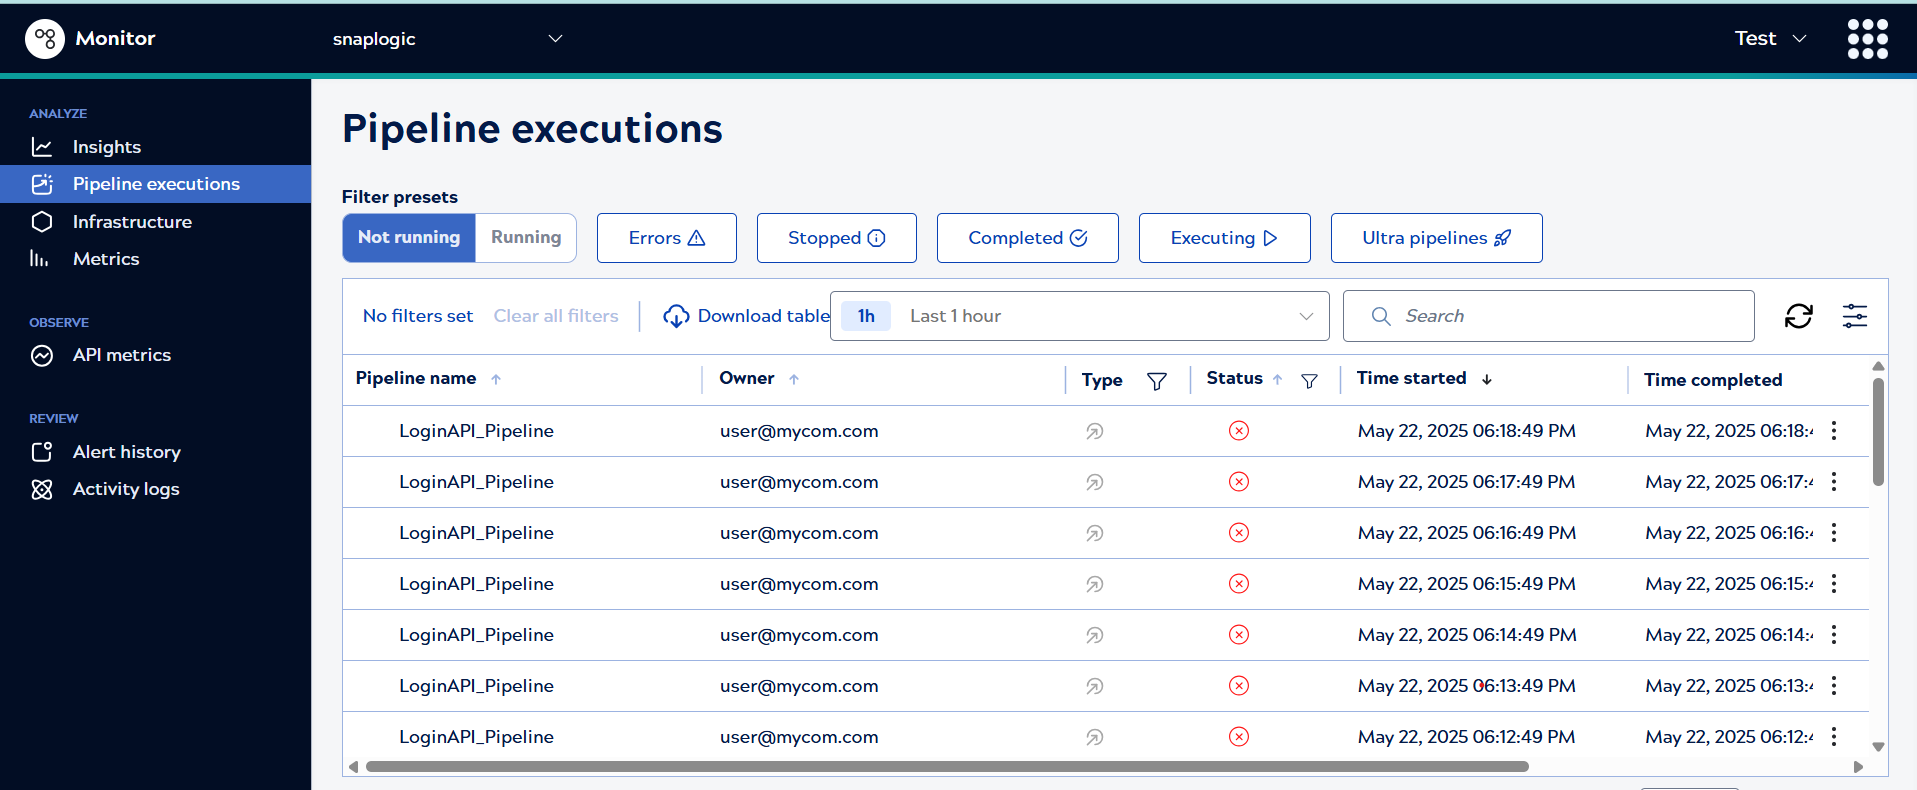
- Pipeline executions—Records of executed and executing pipelines, execution details include errors and logs.
- Infrastructure—Resource use for Snaplexes and their nodes.
- Metrics—Charts of resource use for a Snaplex node.
- API metrics—Consumption and error statistics for all operational APIs. This is available to users in environments with the APIM feature subscription.
- Activity logs—System notifications and events.
- Alert history—Snaplex node alerts.
- Notification center—System and user configured alerts and activity logs. Environment admins can configure alerts from the Notification center.
As you interact with pages, Monitor saves some selections when you switch pages or log out and in.
| Selection | Description |
|---|---|
| Infrastructure list or graph view | Preserved when you switch pages and return or log out and log in again. |
| Pipeline executions table preferences | Preserved when you switch pages and return or log out and log in again. |
| Time period for a page | Preserved when you switch pages and return. |