Tasks tab
The Tasks tab of the Asset catalog lists the tasks created in Designer. Non-admins see only tasks that they have at least read access to.
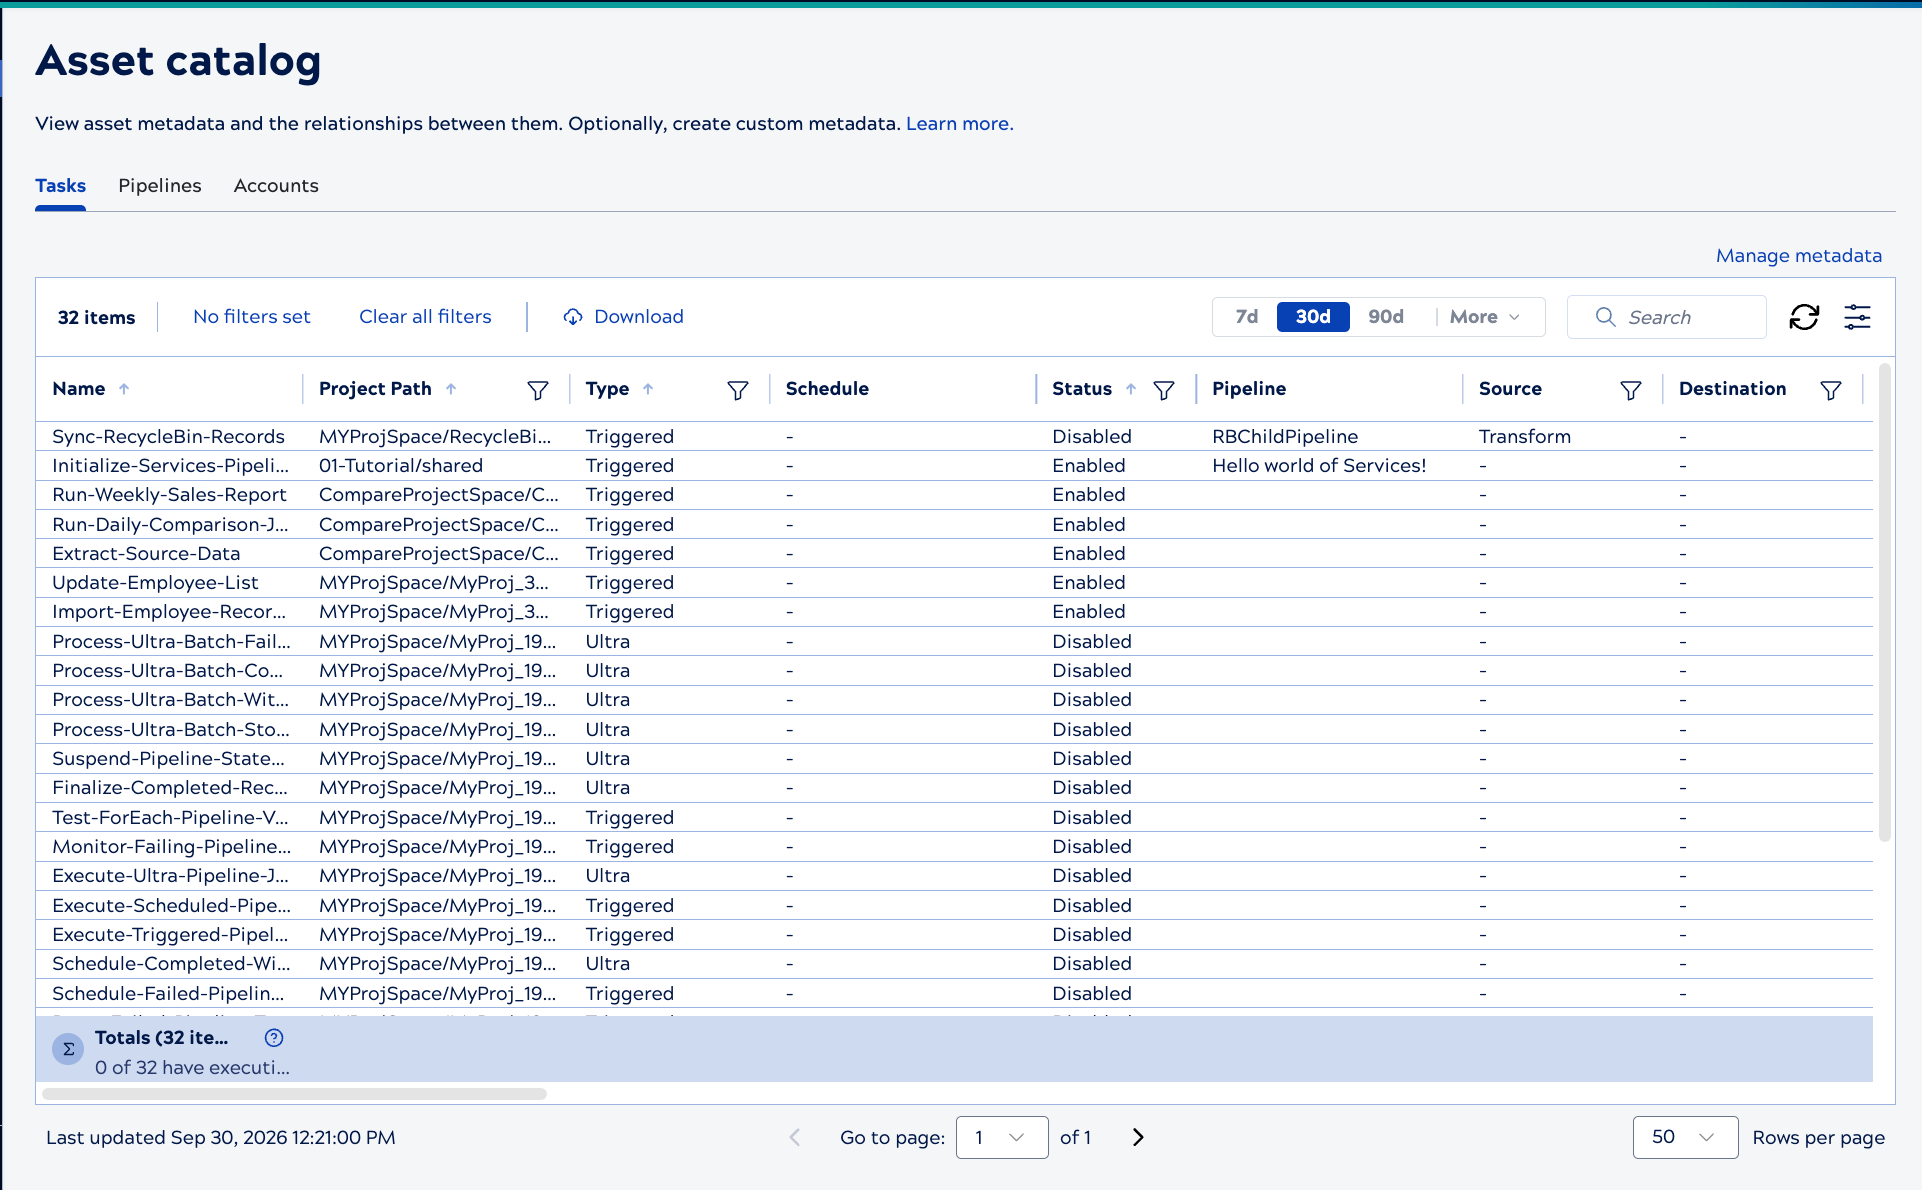
From the Tasks tab, you can:
- View each task's name, project path, type, schedule, status, associated pipeline, and source and destination connectors.
- Search, sort, and filter columns to find a specific task.
- Download the current view as a .csv file.
- Click a task to view its details.
View task details
Click a task to open the details panel. The panel includes:
- A link to open the task in Project Manager.
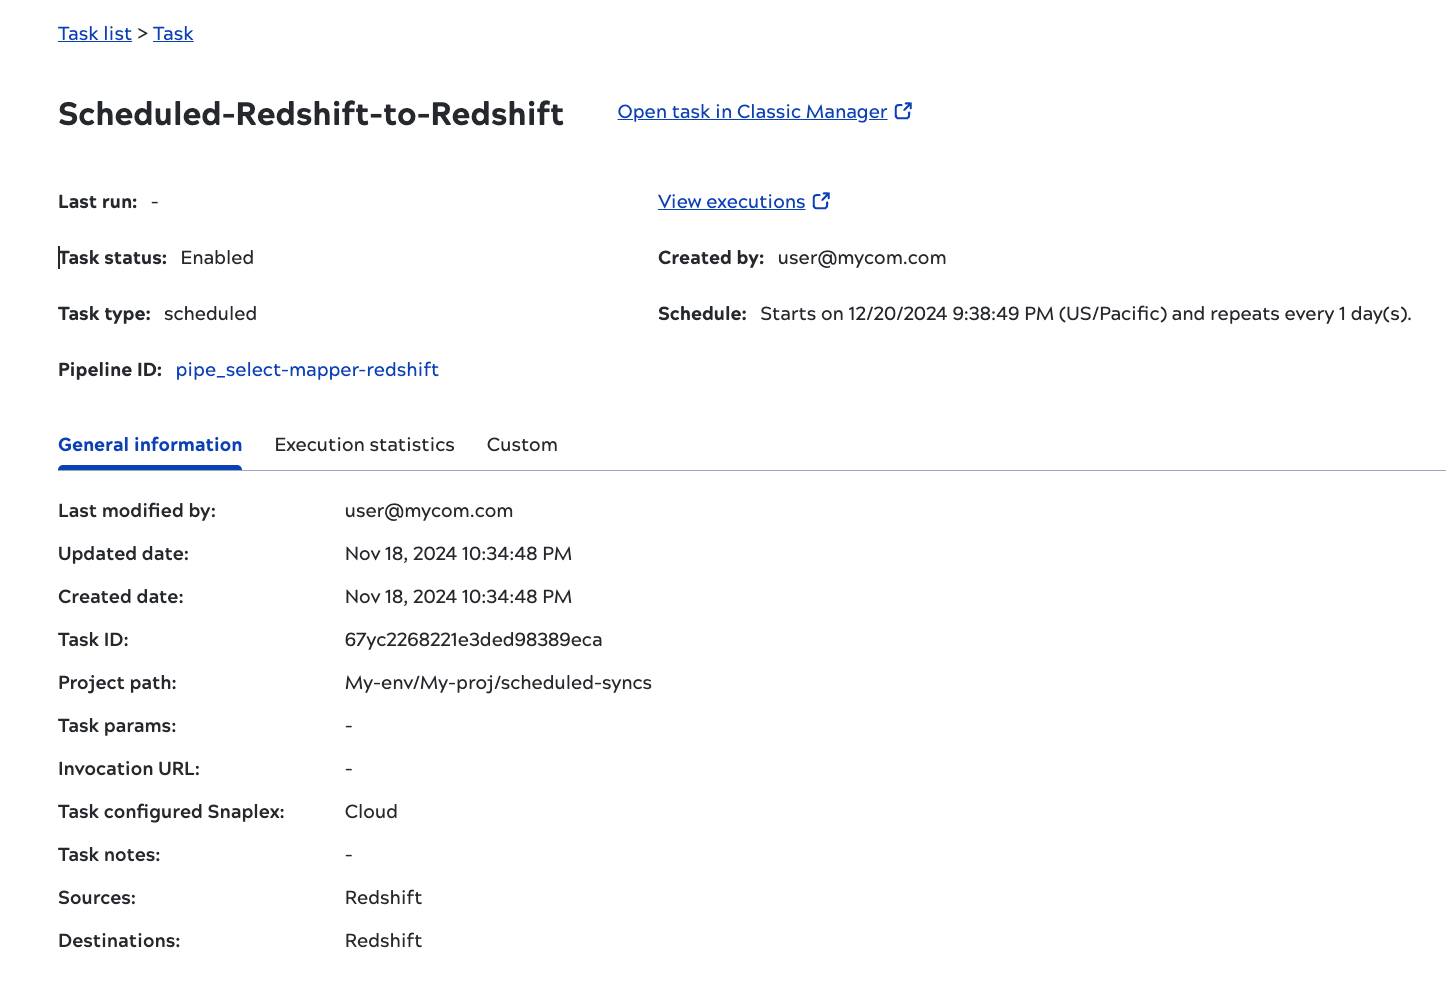
- General information tab: Date created and updated, ID, project path, parameters, and the executing Snaplex. Includes inferred source and destination endpoints, even for pipelines that use generic HTTP and REST Snaps.
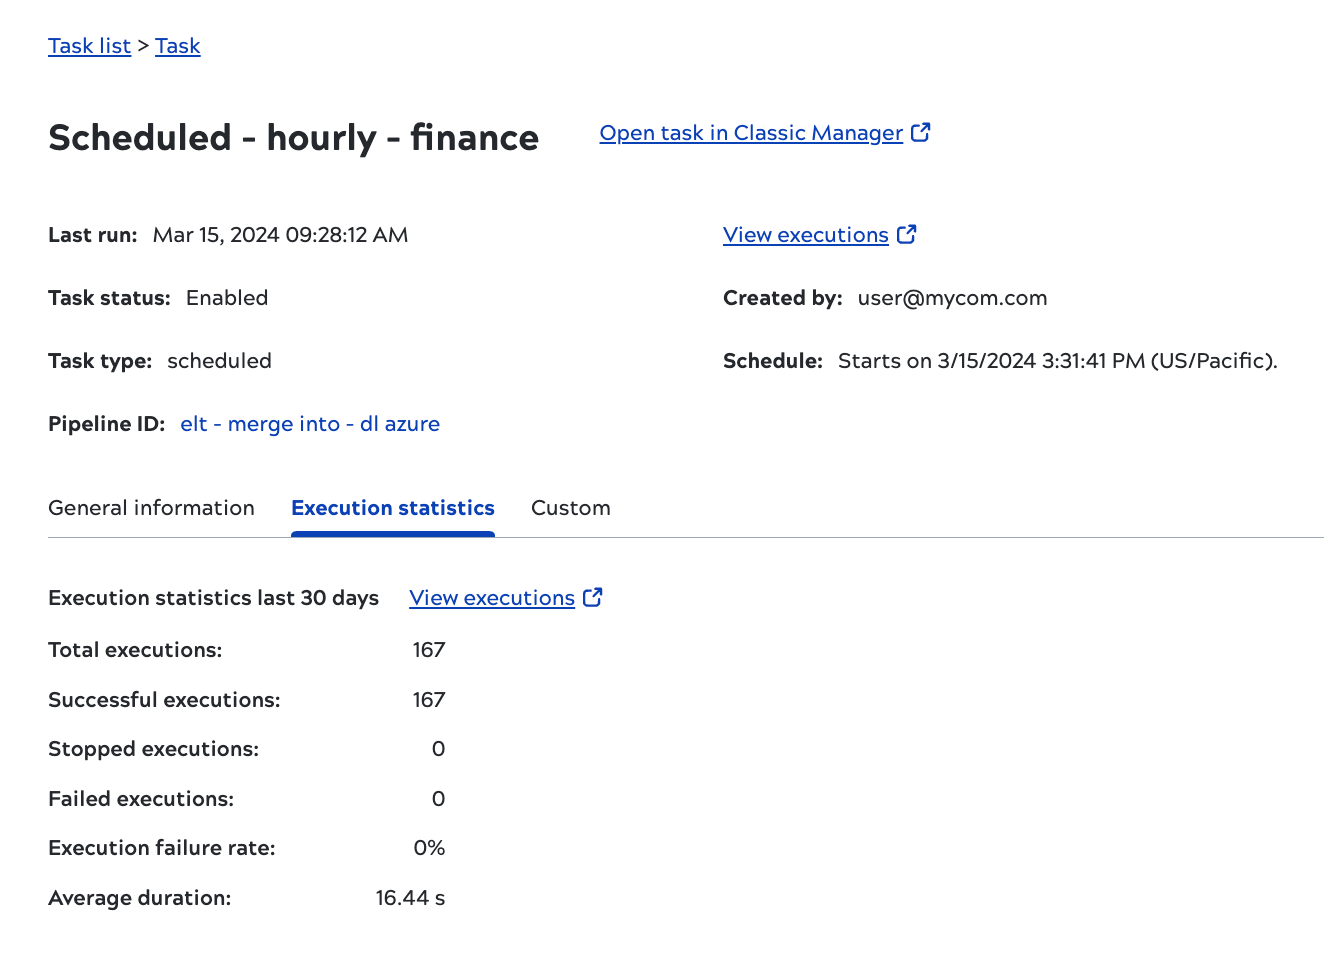
- Execution statistics tab: Number of successful, stopped, and failed executions and average duration.
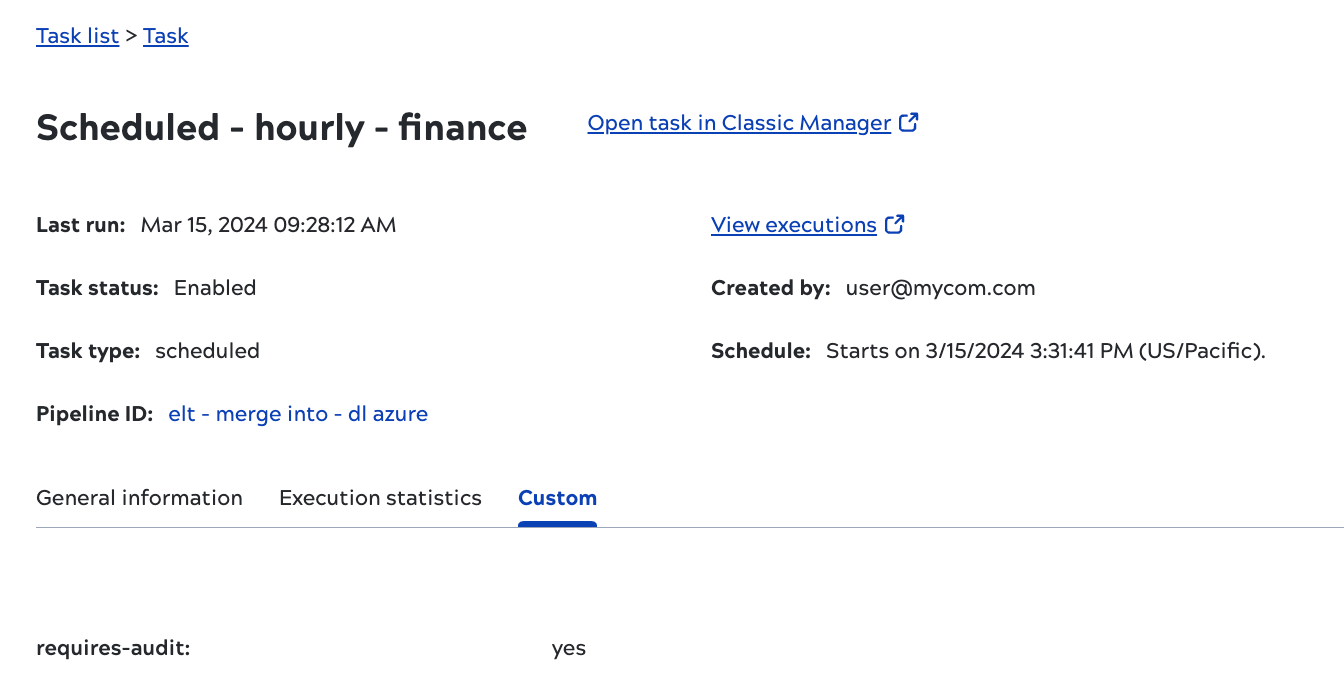
- Custom tab: Custom fields, their values, and a button to edit them.
- Breadcrumb trail: The breadcrumb tracks the navigation trail of assets you click. This
includes navigating to the task details panel from the Task list, and navigating from
there to the associated pipeline. For example, when you
navigate Task list>{task name}>{pipeline name} or Task list>{task
name}>{pipeline name}>{child pipeline name}>{account name}, the breadcrumb
displays the same path.Note:
- Asset names in the breadcrumb show only the first 16 characters.
- The breadcrumb shows only the six most recently clicked assets.
- Clicking any asset in the breadcrumb removes all the trailing assets.
General information tab
The tab displays values from the table columns.
Execution statistics tab
The Execution statistics tab shows data for the last thirty days:
Custom tab
The Custom tab for task details includes any custom metadata. Refer to Add custom metadata to learn how to create custom metadata.