Monitor data pipelines
AutoSync users can view summary information about their own data pipelines. Environment admins can view information about all data pipelines in the environment.
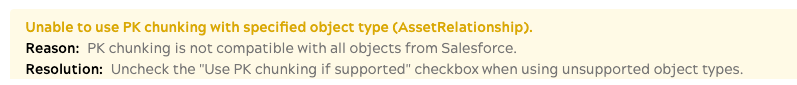
Monitor provides infrastructure metrics and execution details for both AutoSync data pipelines and pipelines created in Designer. Pipelines with warnings can complete successfully.
This page describes how Org admins can find information about AutoSync data pipelines. Refer to the Monitor documentation for information on:
- Analyzing the execution of pipelines created in Designer.
- Viewing metrics for the runtime system.
View data pipeline summaries in the dashboard
In addition to searching for a specific data pipeline, you can filter the AutoSync dashboard to display cards for:
- Data pipelines you created.
- Data pipelines you marked as favorites.
- All data pipelines.
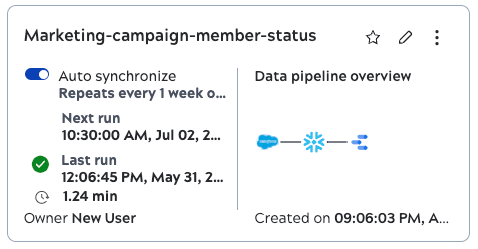
As shown in the following example, a data pipeline card includes:
- A toggle to enable or disable synchronization.
- The next scheduled run.
- The last run and elapsed time.
- A toolbar with controls to mark as a favorite, edit, and options to run now or delete.
- Icons that identify the source, destination, and purpose of the pipeline.
- The creation date.
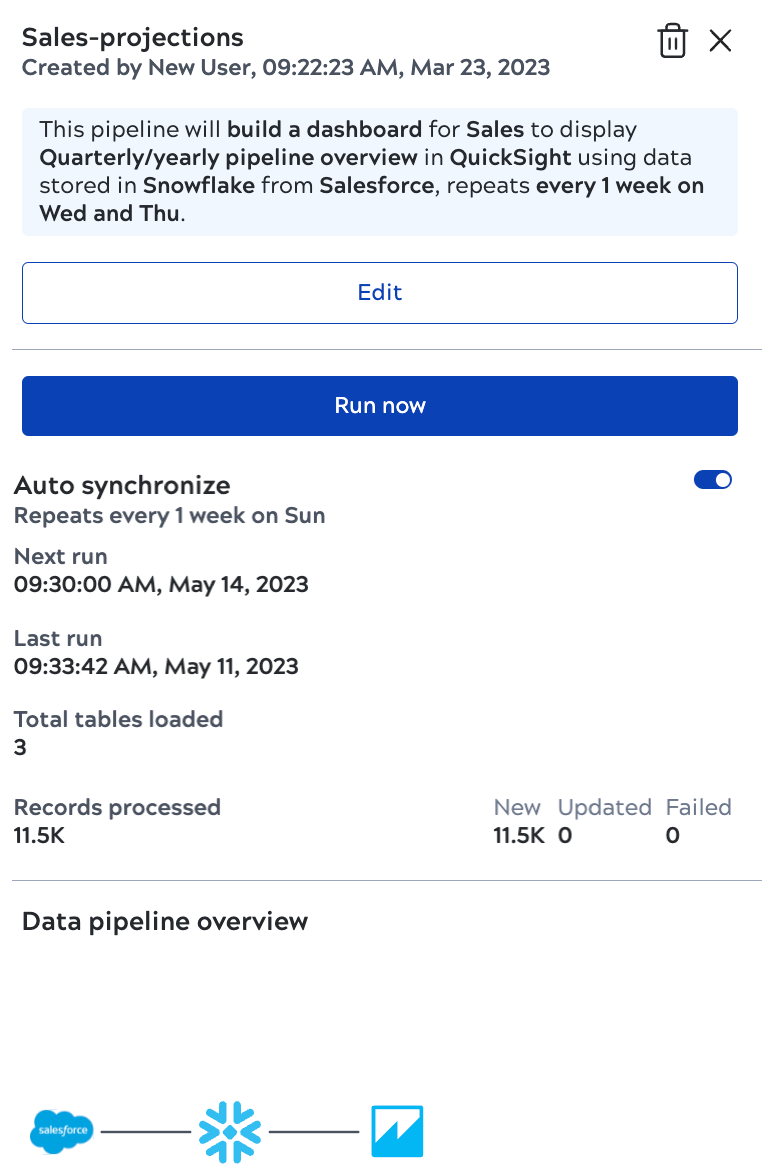
To see more details, click the card. A panel opens that includes additional information:
- The full description.
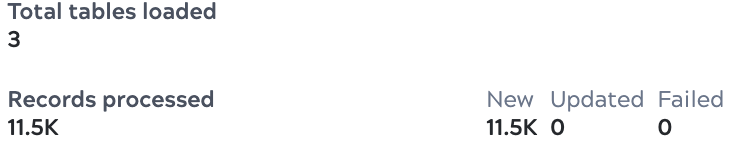
- The number of tables loaded.
- The number of records newly uploaded, updated, or failed.
View data pipeline executions in Monitor
The system creates AutoSync data pipelines for you. You can't edit them. However, viewing execution information can be useful to you and helpful if you need to contact Support.
Note that:
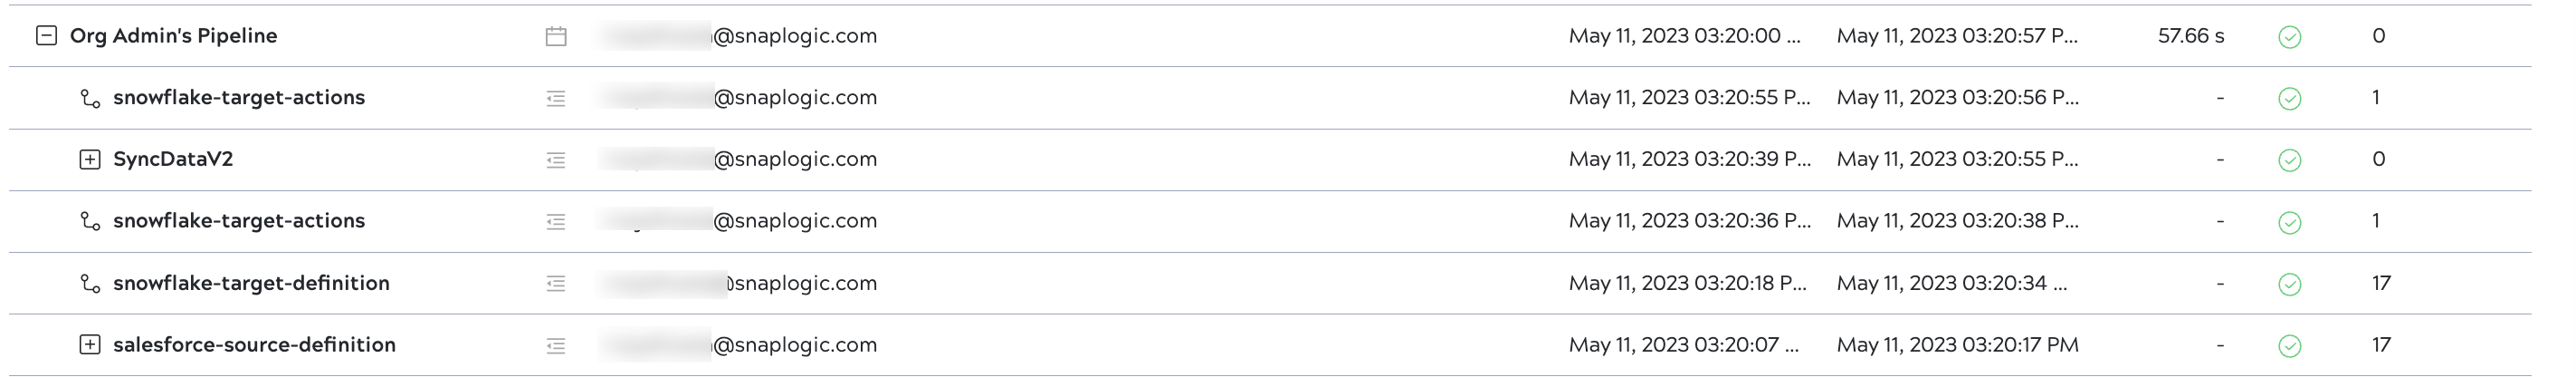
- An AutoSync data pipeline is composed of a parent and several child pipelines.
- The number of documents processed for the parent data pipeline can be 0 or 1, it does not refer to the number of records loaded.
- The number of documents processed for child pipelines is cumulative, not per object or per table.
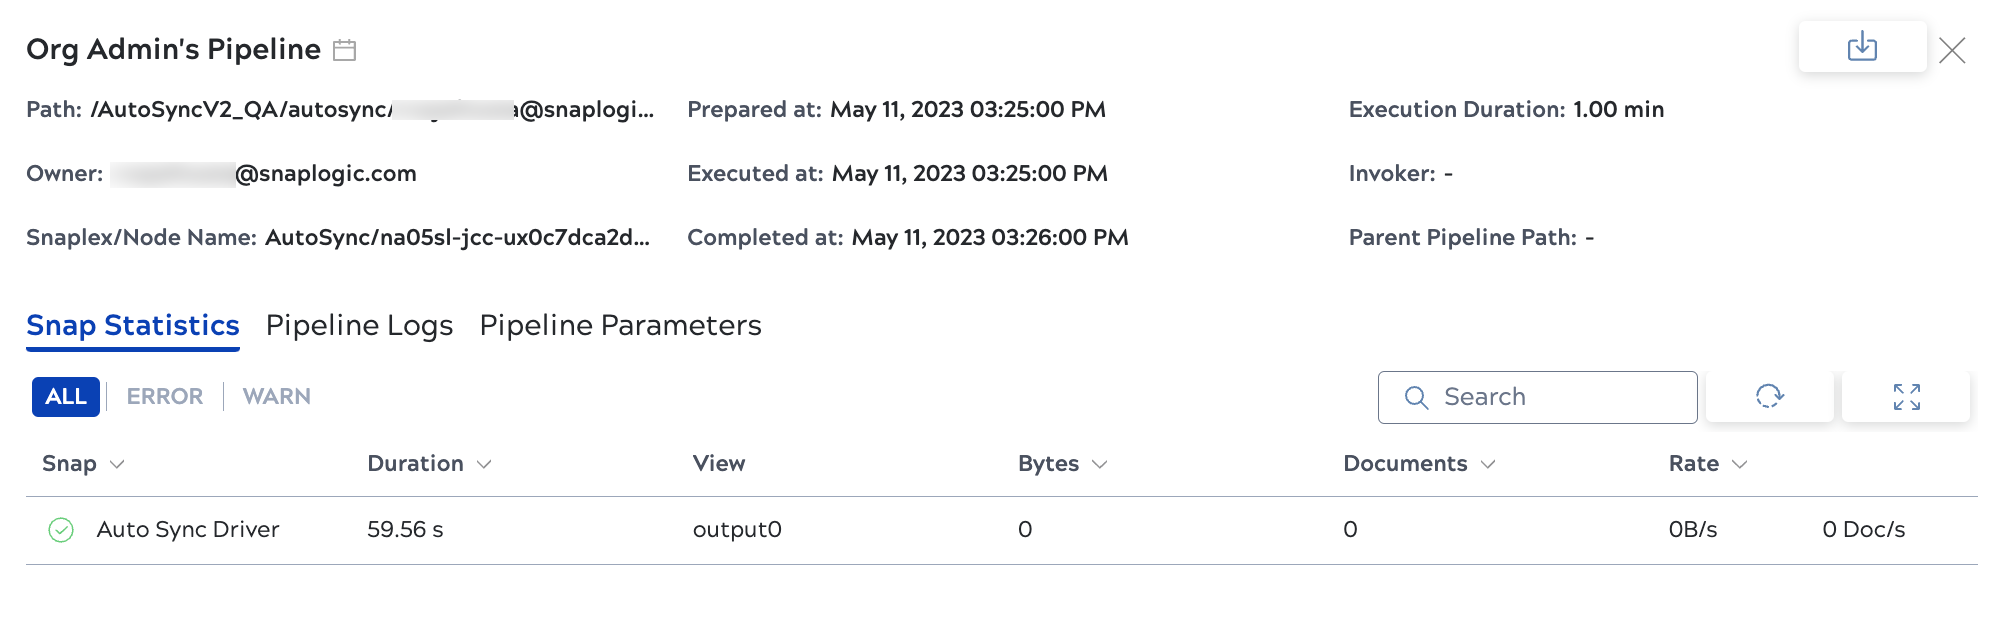
Click a pipeline to view the details panel:
View loading summary
The first time AutoSync runs a data pipeline, it loads all records from the specified objects or tables. On synchronization, it updates any changed records and adds new ones. You can see the records processed organized by the number of new, updated, or failed. Refer to How AutoSync loads data for more information.
To view the loading summary in the AutoSync dashboard, click the data pipeline card to open the details panel: