


Parse charts from a PDF file
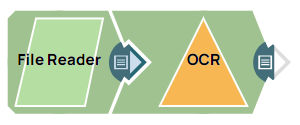
This example pipeline demonstrates how to parse graphs and charts from a PDF file and add a scannable layer to the original file.
-
Configure the OCR Snap as shown below:
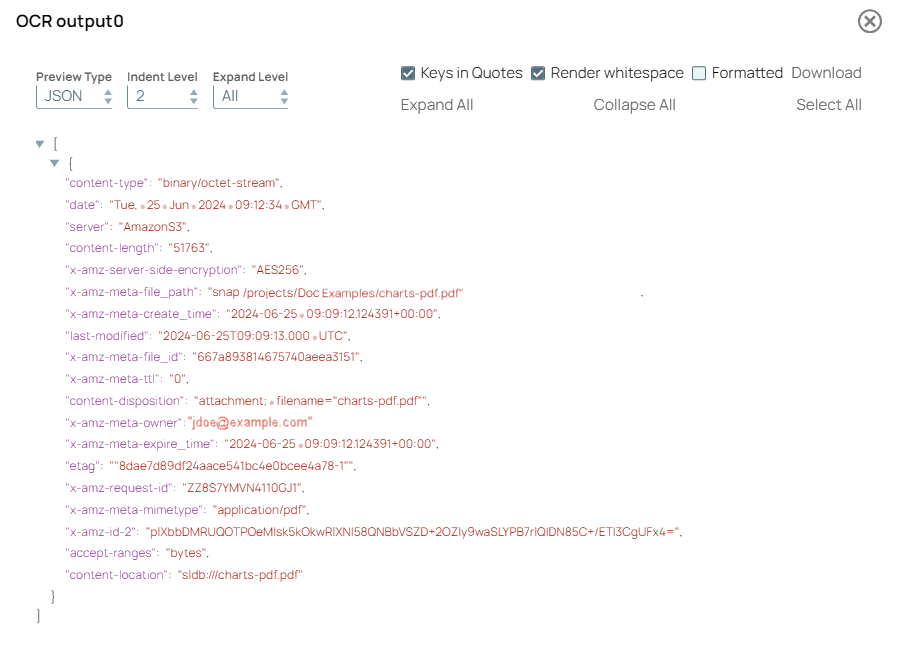
On validation, you can view the extracted text from the graphs and charts in the output preview.
OCR Snap configuration OCR Snap output 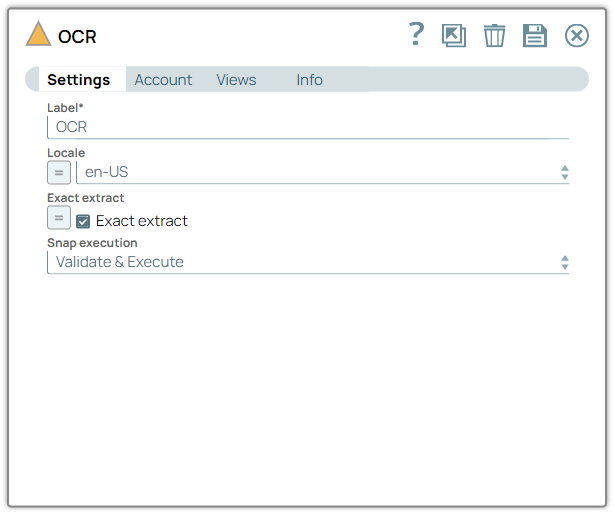
- Download and import the SLP file into your Environment.
- Configure Snap accounts.
- Provide Pipeline parameters, if any.