


Snaplex details panel
From the Infrastructure page, click a Snaplex to open the details panel. You can access Snaplex details from the Graphs view or the Snaplexes view. Snaplex details include information on the Snaplex and its nodes:
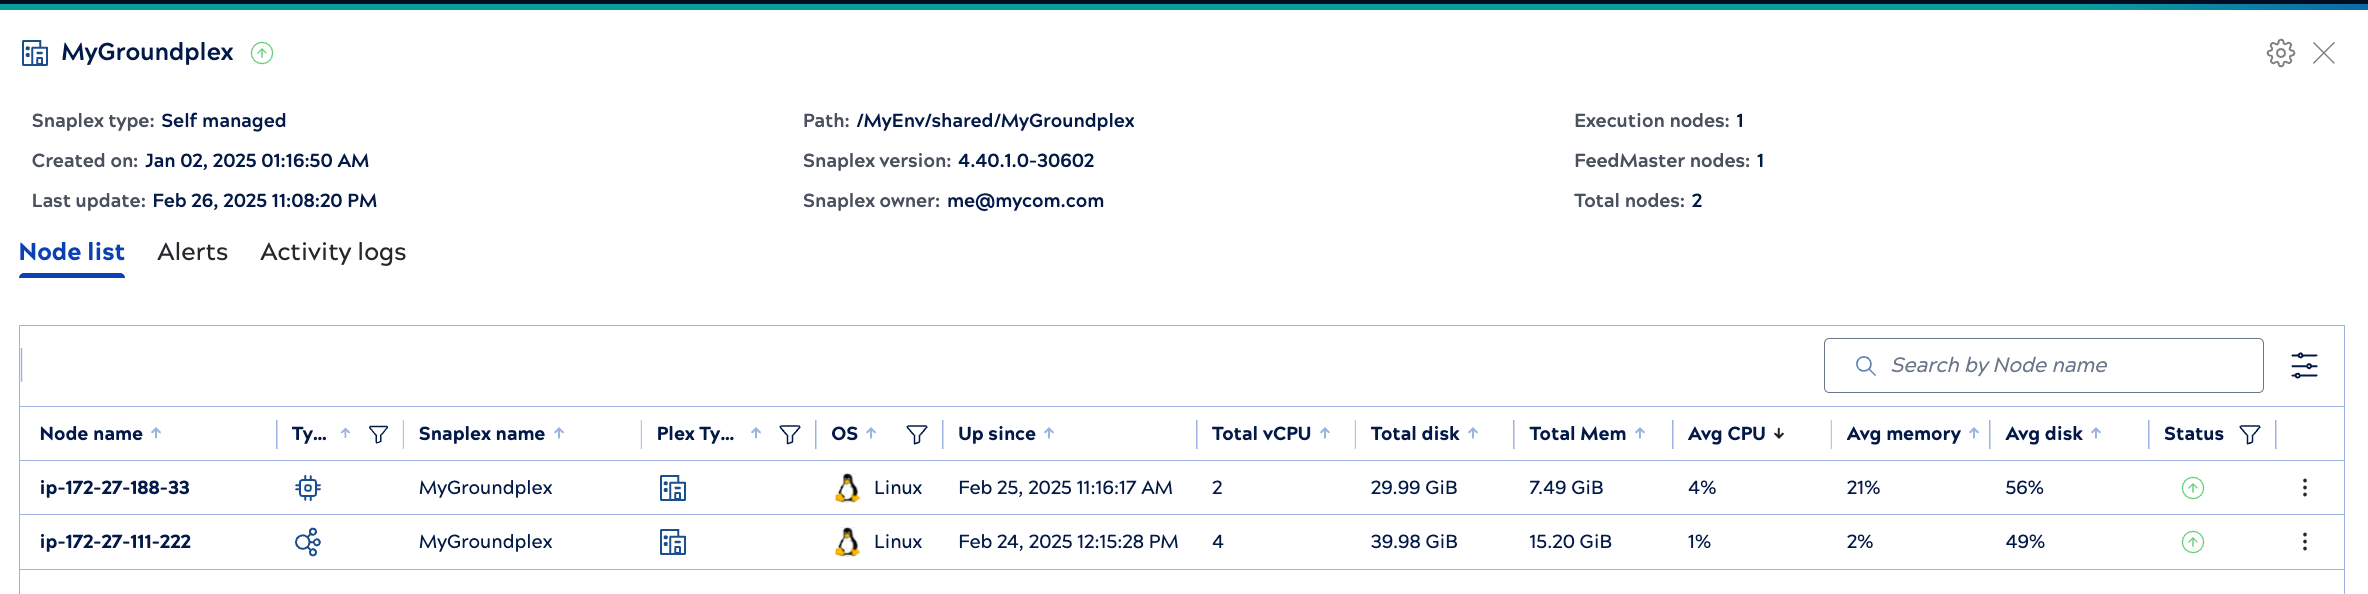
From the details panel:
- Click Metrics to view multi-node graphs for the Snaplex.
- View the active nodes and their type, Execution
 or FeedMaster
  .
. - For Groundplexe nodes, Org admins can click the three dot menu to start, restart, or put the node in maintenance mode.
- Click a node to view its details.
- Click the Alerts tab to see all node alerts.
- Click the Activity log tab to view events for all Snaplexes.
Alerts tab
The Alerts tab shows the node alerts for the Snaplex that also show on the Alert history page. Refer to Node initialization alerts for a description of initialization alerts.
Activity logs tab
The Activity logs tab shows the events for the Snaplex that also show on the Activity logs page.