


Insights
The Insights page shows an overview of environment use. Data collates daily at midnight UTC and the page refreshes when the data is ready. For example, data from Monday isn't added until a few hours after midnight on Tuesday.
Tip: The Last updated value reflects when you opened the page or refreshed it,
not the time environment statistics were updated.
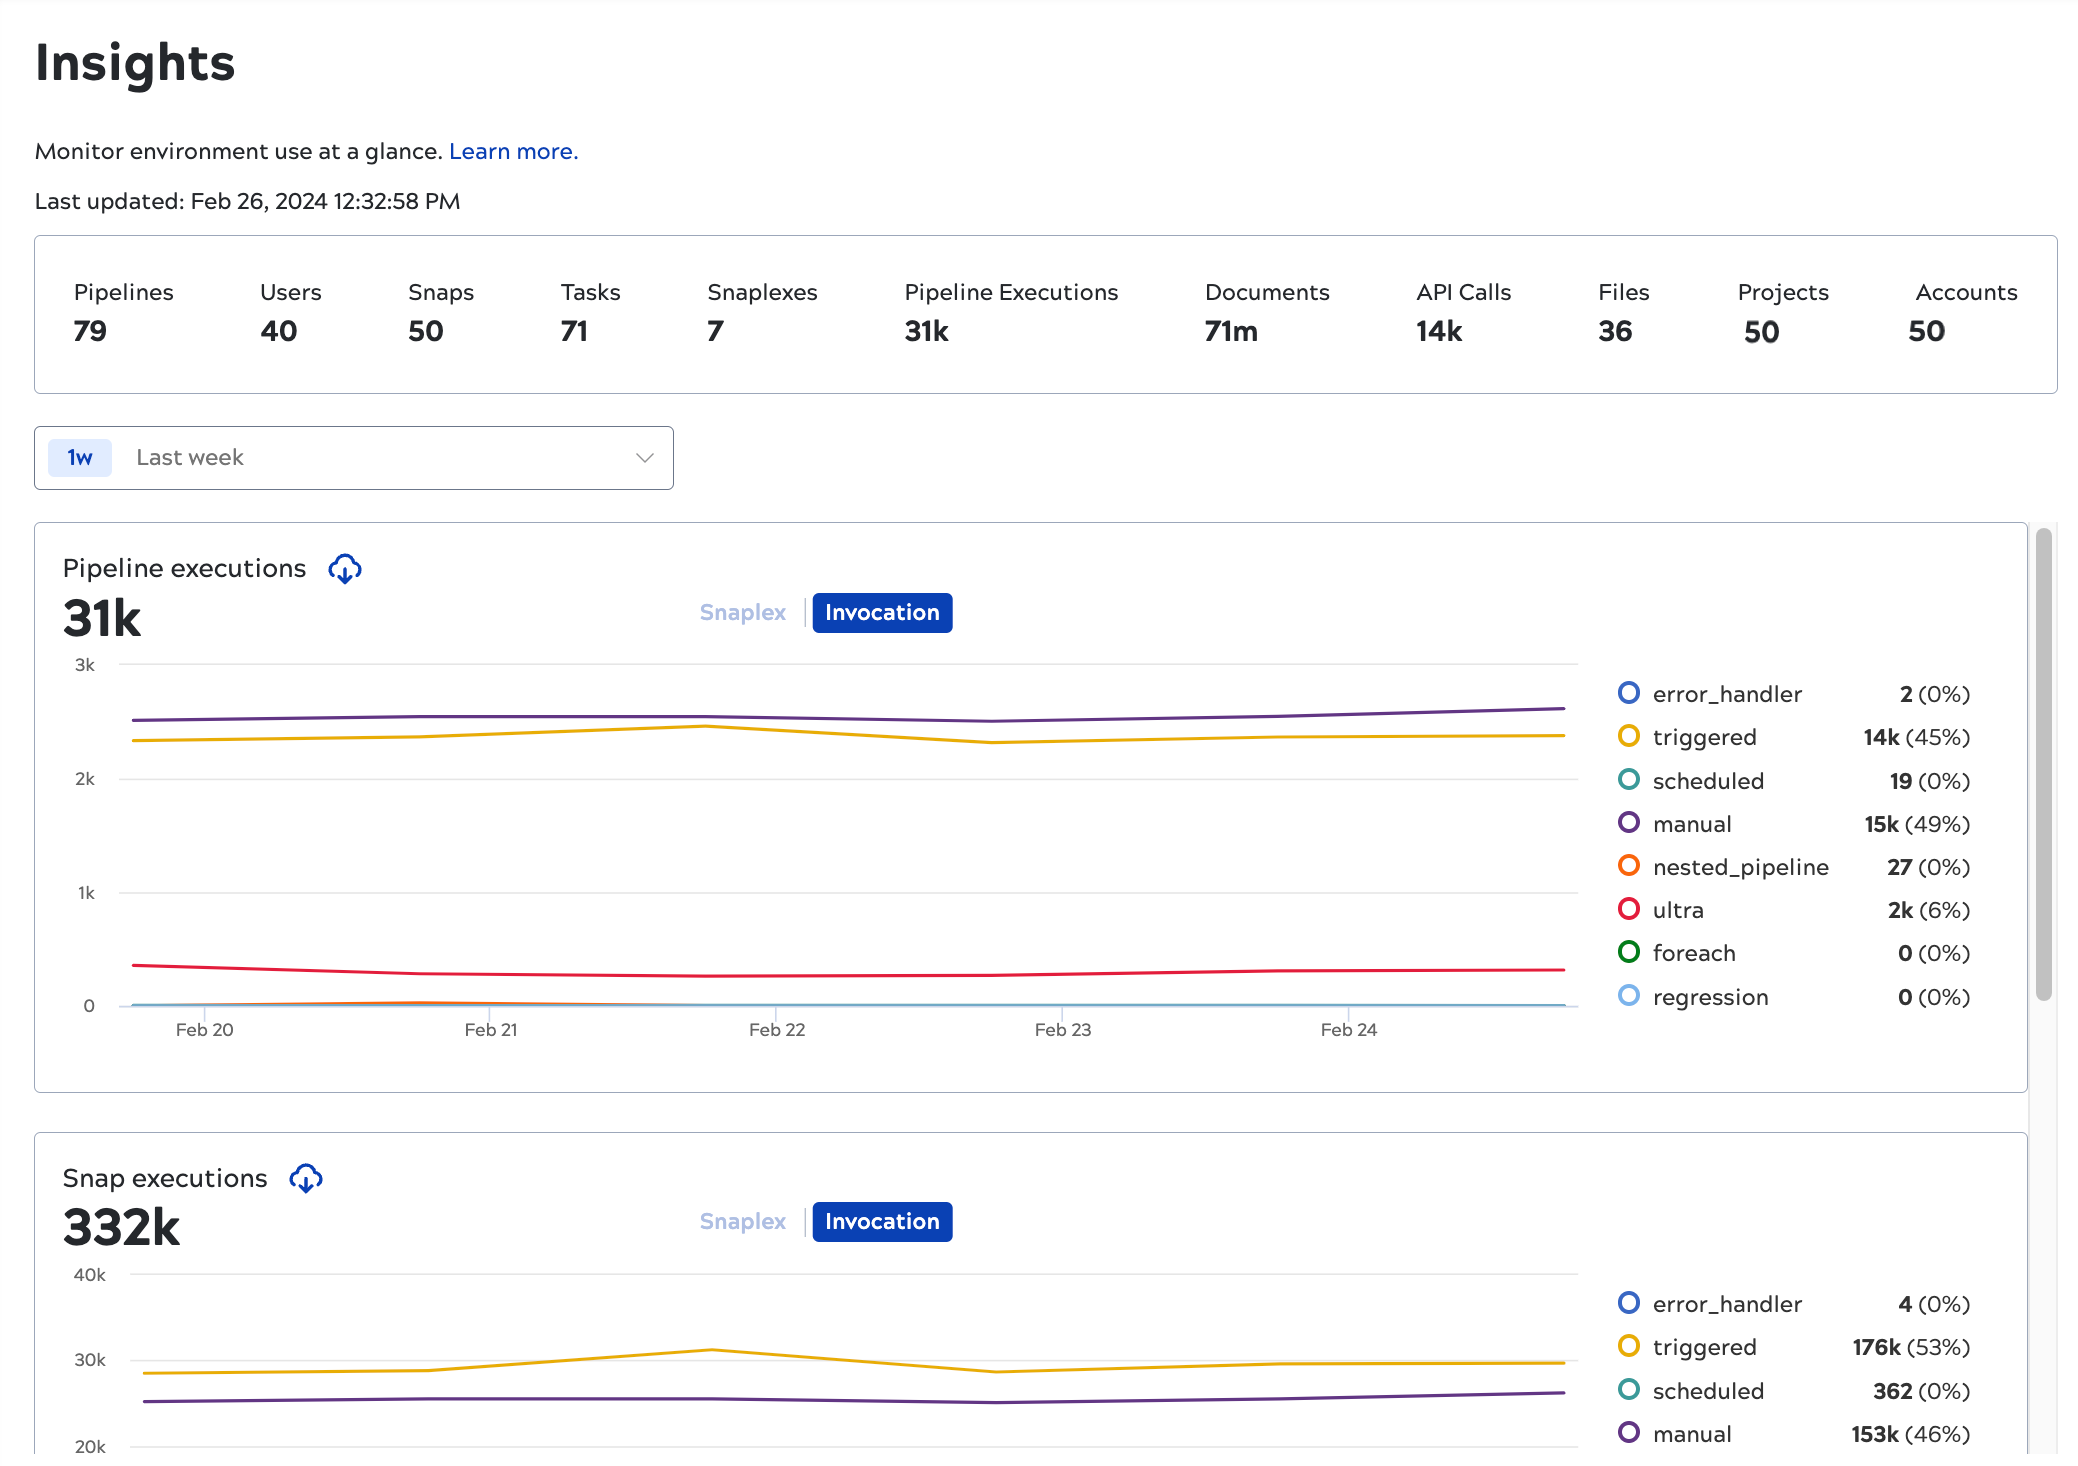
The top of the page summarizes statistics for the selected time period:
- Pipelines: The number of pipelines.
- Users: The number of users who logged in.
- Snaps: The number of Snaps in pipelines that executed.
- Tasks: The number of Tasks that executed.
- Snaplexes: The number of active Snaplexes.
- Pipeline executions: The number of times that pipelines ran.
- Documents: The number of documents processed by pipelines.
- API calls: The number of API calls.
- Files: The number of file assets in the environment.
- Projects: The number of projects in the environment.
- Accounts: The number of Snap accounts in the environment.
The charts can display statistics by Snaplex or by invocation type for:
- Pipeline executions
- Snap executions
- Documents processed
The Insights summary rounds large values and uses one of the following notations to indicate the quantity:
| Notation | Meaning |
|---|---|
| K | Thousand |
| M | Million |
| B | Billion |
You can:
- Change the time period to:
- The last week
- The last month
- The last three months
- To start any day within the last year
- Display graph results by Snaplex or by invocation type.
- Download graph data as a .csv file.
- Hover over a graph line to view individual data points.