


Troubleshooting
Find and troubleshoot Snaplex and pipeline issues.
Snaplex and node issues
The Node diagnostics table shows the maximum, minimum, recommended, and current values for configurable node parameters to help you maximize performance and avoid issues. It also shows average and peak RAM usage.
To view the Node diagnostics table in Monitor:
- Navigate to the Infrastructure page.
- Click a node to open the details panel.
- Click the Additional details tab.
Pipeline issues
You can run validate and run pipelines in Designer to troubleshoot issues during development. To see more runtime information in Monitor:
- With the pipeline open in Designer, in the toolbar, click Execute
Pipeline.

- In the toolbar, click Pipeline Statistics.
 The Pipeline Execution
Statistics dialog opens.
The Pipeline Execution
Statistics dialog opens. - Click the title to open the record of the pipeline run in Monitor as shown below:
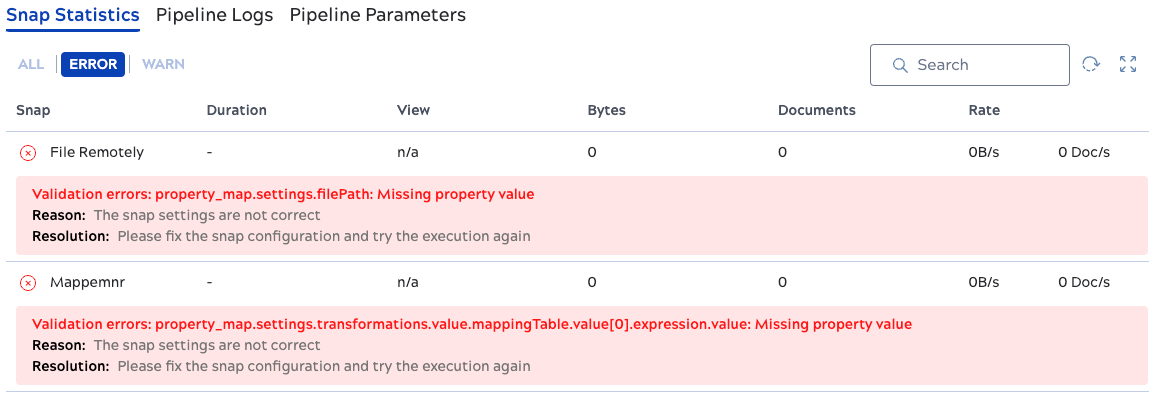
- Find the Snap error messages for debugging.
- Identify performance bottlenecks using Snap statistics.
- Download logs.
Find the problem production pipeline
Finding the pipeline to debug can be challenging, especially in environments with tens of thousands of pipelines in production. The error report might come from an external source such as Zendesk. External incident reports often refer to the data by some unique identifier, such as a purchase order number. Because SnapLogic does not store record data or metadata, a simple search in the Pipeline executions table cannot identify the pipeline that processed those records.
Encourage pipeline developers to use the best practices that enable others to find pipelines:
- Name pipelines using a convention that helps others understand their purpose.
- Organize related pipelines in logically-named projects in the same Project space. You can filter the Pipeline executions table by Project space and project.
- Document the pipeline purpose and the systems it interacts with. This might be in a document such as a spreadsheet.
- Use pipeline parameters to capture a value that maps to a record. The string search returns results for parameter values.
- Use error pipelines to output and store record data when a failure occurs.
Identify the Snap error
After locating the problem pipeline in the Pipeline executions table, identify which Snap or Snaps encountered an issue. Click the pipeline to open the details pane. From the details pane, try the following to learn more about the error:
- Use the Error filter on the Snap statistics and Pipeline logs tabs to bring errors to the top:
- Use the All filter on the Pipeline logs tab to find out what happened just before the error.
In the case of errors caused by the data itself, such as formatting issues, you will need to find the issue and fix it in the source. This is easier for pipelines with an error pipeline that stores record data when a failure occurs.
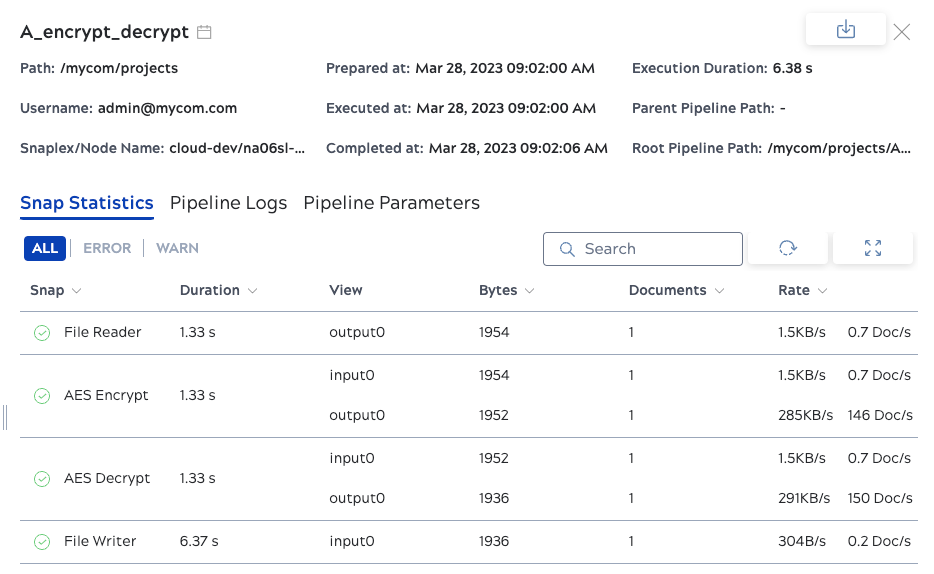
Identify performance bottlenecks
Use the key metrics on the Snap Statistics tab to find the Snap that limits pipeline throughput. Look at document rates and input time together, not the rates alone.
An upstream Snap with a low output document rate and a downstream Snap with a high output rate and high input time indicate a bottleneck in the upstream Snap. The downstream Snap processes documents quickly when it receives them, but spends most of its time waiting.
For example, an XML Parser Snap feeds an XML Formatter Snap with the following statistics:
- XML Parser Snap output rate of ~1.3 docs/sec.
- XML Formatter Snap output rate of ~54 docs/sec, with a high input time.
This indicates that the Formatter can process documents much faster than the Parser delivers them. The Parser is the bottleneck. The high rate on the Formatter reflects its unconstrained processing speed, not the end-to-end throughput of the pipeline.
Download logs
To download pipeline logs:
- In the Pipeline executions table, click the pipeline execution of interest to open the details panel:
- Select the Pipeline Logs tab.
- Click download.

The log downloads to your computer.
Completed with errors
Pipeline displays Completed with error state:
- When data goes to the error view, it is marked as Completed with errors. It’s a new
state added to Monitor to make it clear that the pipeline has completed but has some
data going to the error pipeline. This new state arises when the Snap in the
error pipeline has ‘Format each document’ and ‘Ignore empty stream’ unchecked, causing
an empty output document.
-
Resolution: Checking ‘Ignore empty stream’ in the Snap is recommended to prevent false error statuses when no error documents are routed.
-