View a data pipeline
How to view an AutoSync data pipeline from the dashboard.
The AutoSync dashboard displays a summary card for each data pipeline:
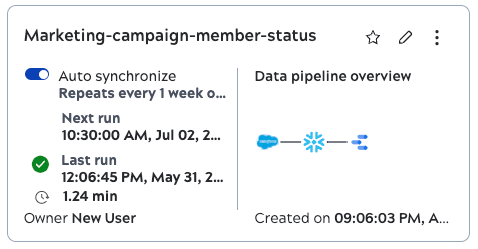
Click the card to view the details panel. From the details panel:
- View the full description.
- Edit, delete, or run the data pipeline.
- View the number of tables loaded and for the last run, the number of records
processed: new, updated, or failed. To view the detailed information about the loaded
tables, such as source, table name, requested load, and other details, click
More details.
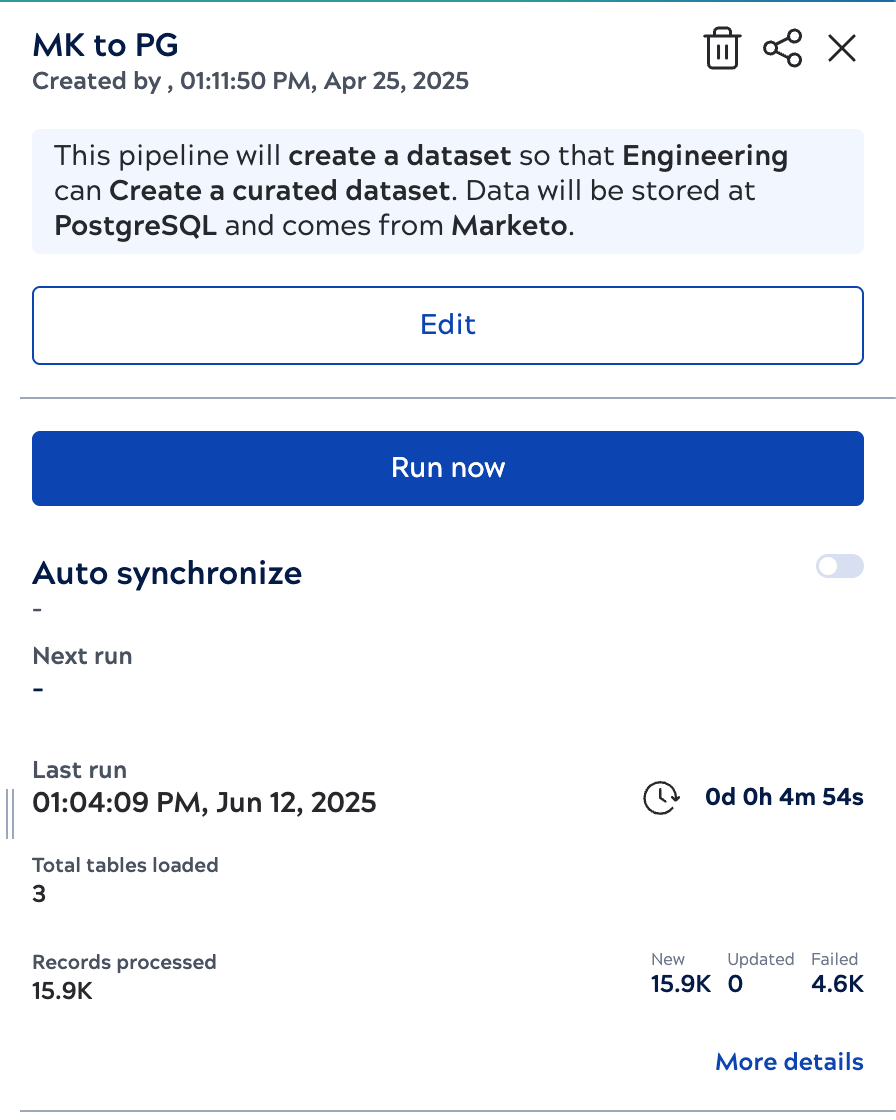
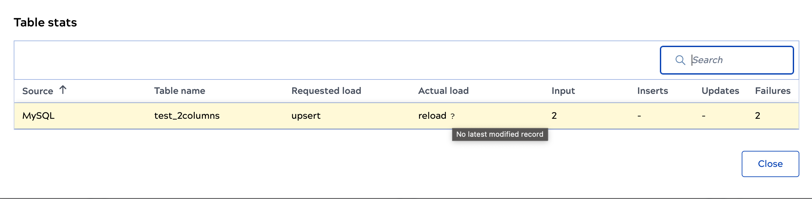
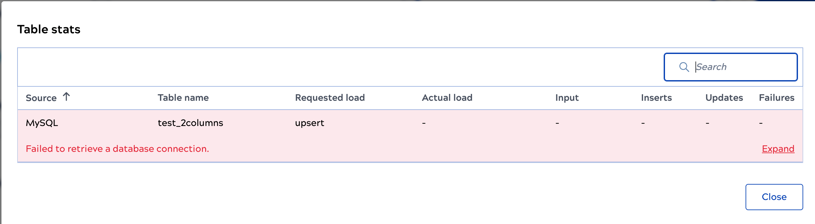
Table stats dialog
Click the More details link to view the following information
about the loaded tables:
- Row counts per table for Input, Inserts, Updates, and Failures.
- Search and sort options to filter the tables.

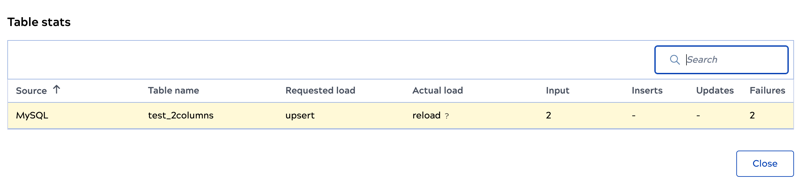
- Requested and Actual loads: If the Actual load is different
from the Requested load, hover over the ?
icon next to the Actual load to know the reason for the load
mismatch.
-
Color-coded status:
- Red rows for execution errors. Click Expand to view the
error details.
- Yellow rows for the completed load with row-level failures.
- Red rows for execution errors. Click Expand to view the
error details.
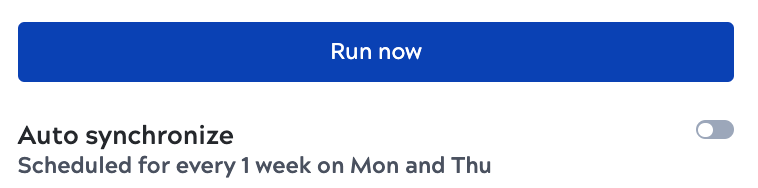
Tip:
If you disable Auto synchronize, the card displays a dash under Next run.
You might want to view the saved schedule before enabling it again.
To do this, click the card to open the details panel.
The schedule displays under the Auto synchronize field: