


Snap statistics tab
View per-Snap CPU, memory, duration, and document throughput for a pipeline execution.
The Snap statistics tab provides information about each Snap in the pipeline. As a pipeline executes, the Snap statistics update periodically.
Owners of child pipelines can only view Snap statistics for the parent if at least one of the following is true:
- They also own the parent pipeline.
- They have read permission for the project that contains the parent pipeline.
Snap statistics table
By default, the Snaps display in the order they appear in the pipeline in Designer, from
left to right. If two or more of the same Snaps are at the same depth, they can appear in
any order. Click the Snap column to sort them alphabetically by name.
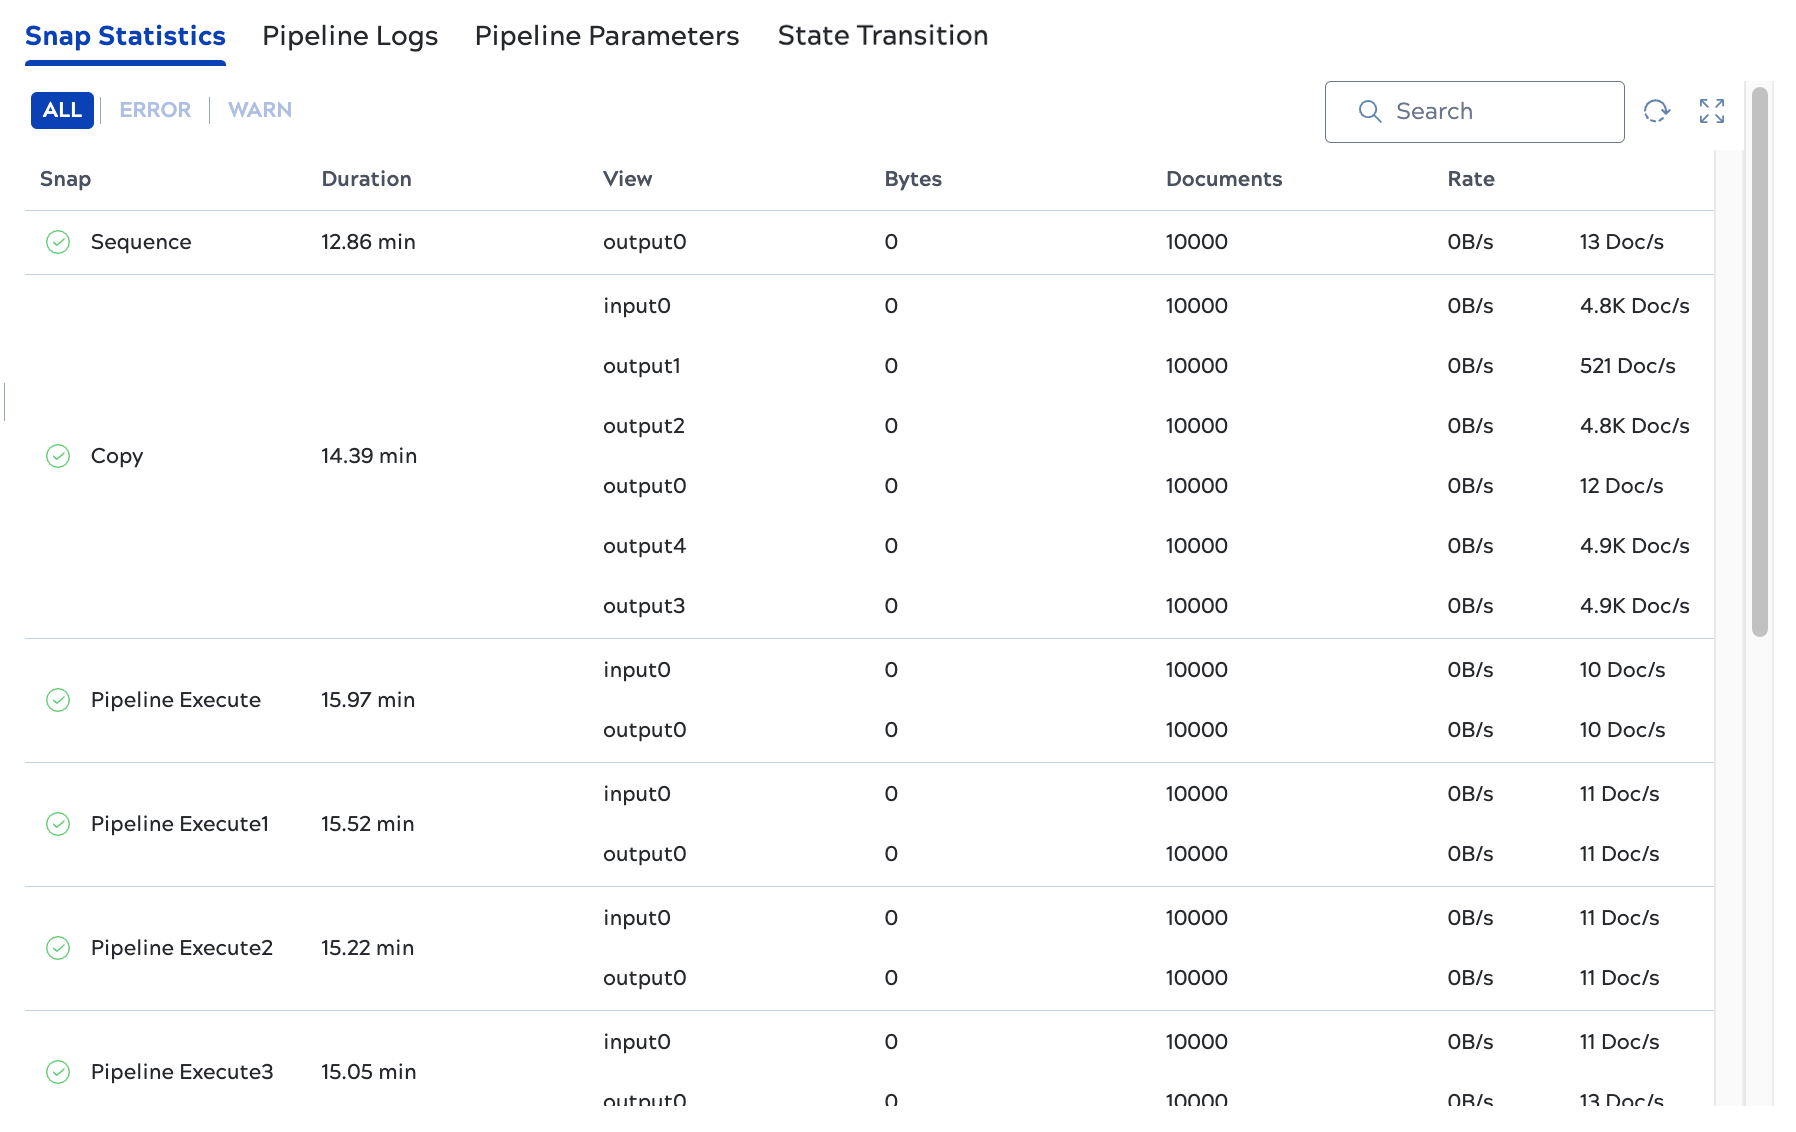
Table columns include:
- Snap: The Snap name and status icon.
- Duration: The total elapsed time for the Snap, from start to finish. This is the same value as Total time in the Snap detail panel (Input time + Execution time + Output time). Displayed in milliseconds, fractional seconds, or fractional minutes. Because Snaps can execute in parallel, the total pipeline duration is often less than the sum of individual Snap durations.
- CPU: The percentage of CPU time the Snap consumed while processing.
- Memory: The amount of memory allocated for the Snap.
- Net: The network throughput for the Snap.
- View: Snap views accept documents to be processed or output documents. Each view has its own statistics for document count and throughput rate.
- Bytes: Only populated for Snaps with binary views. The quantity of data that passed through the view.
- Documents: The number of structured or binary documents that passed through the view.
- Rate: An approximate calculation of how many documents pass through the view per second. For Snaps with binary views, the byte rate is also displayed.
With the Snap statistics tab selected, you can:
- Click the refresh icon to refresh the Snap statistics manually.
- Click any column except View to sort alphabetically or numerically.
- Click ALL, ERROR, or WARN to filter the list by Snap status.
- Click a Snap row to open a panel with its status and additional information about that
Snap, such as execution time, Snap ID, and the Snap Pack build number. Click
 to close the panel.Fields include:
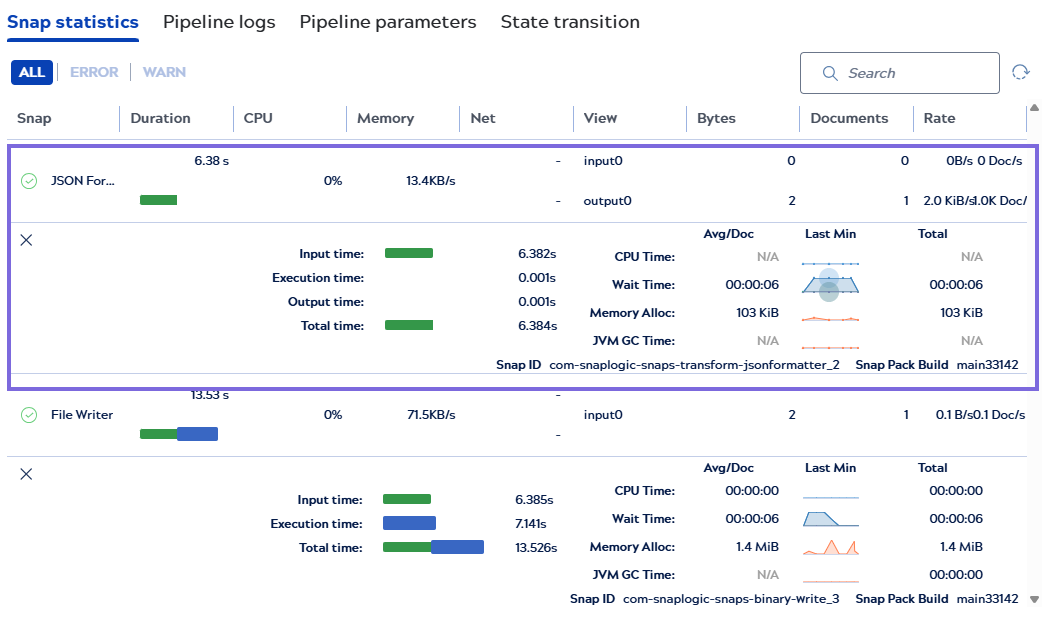
- Input time: The amount of time this Snap waited for the previous Snap to provide input. This field doesn't display for Snaps that don't receive input from another Snap.
- Execution time: The amount of time this Snap spent processing.
- Output time: The amount of time this Snap spent sending data to the next Snap.
- Total time: The elapsed time from when the Snap waited for input to when it finished sending output.
- Snap ID: This is the Class FQID that you can find on the Info tab of the Snap in Designer.
- CPU time: The amount of CPU time spent processing the Snap.
-
The Duration bar chart provides an overview of how long the pipeline takes during the processing of each document. The width of the chart represents the overall run time of the Snap and is broken down into three sections with different colors:
- Input wait time as green.
- Execution time as blue.
- Output wait time as purple.
Note: Any Snap, especially Snaps with multi-input views, may report an Input time that exceeds the actual Execution time or total pipeline wall-clock time. The Snap statistics panel and execution logs might display misleading time breakdowns for the Snaps. This behavior is by design because the views are read concurrently, and their IO times overlap in real time. The resulting total does not reflect the actual elapsed time. To assess pipeline performance, refer to the pipeline wall-clock duration (start to completion) rather than the per-snap Input time metric.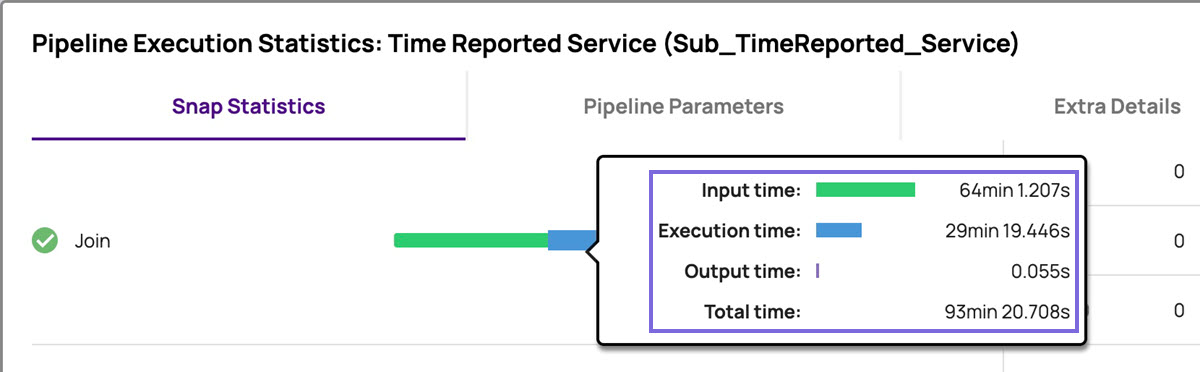
The input time and output time are how long the Snap takes waiting for its neighbor Snaps to do their processing. The execution time is how long the Snap takes to process documents. You can hover over the Duration bar to see the exact amount of time that the Snap takes waiting or executing.
- Wait time: The amount of time the Snap waited for input, output, or internal processes.
- Memory alloc: The number of bytes that the Snap allocated to process all of the documents. For example, with a value of 5MB for 32 documents, the Snap allocated approximately 164KB per document. When combined with other statistics, this number can help you identify the potential causes of performance issues.
- JVM GC time: The amount of time for JVM garbage collection.
- Snap Pack Build: The Snap Pack build number.
Key metrics for performance analysis
The following metrics are the primary signals for reasoning about pipeline performance and bottlenecks. For guidance on diagnosing performance issues, refer to Identify performance bottlenecks.
- Rate for the input view (docs/sec): How fast a Snap receives documents from upstream.
- Rate for the output view (docs/sec): How fast a Snap emits documents downstream.
- Input time: How much time the Snap spends waiting for upstream input. A high input time indicates the Snap is idle because the upstream Snap is slow to deliver documents.
- Execution time: The rate at which the Snap processes each document. For some Snaps, the tab also displays a byte rate.
Snap warnings and errors
Warnings display for Snaps when the system detects a potential issue that you can address. For example, pipelines that use a deprecated version of the Join Snap display a warning. Pipeline executions with warnings show up in the execution table with a warning icon. Examples of warnings include:
- Deprecated Snap: Snaps that are no longer supported should be replaced with newer versions of the Snap to avoid any potential issues.
- Passing a string to the
toLocaleDateTimeString(),toLocaleDateString(), andtoLocaleTimeString()methods: Early versions of these methods would only accept a JSON-encoded string for the format argument. More recent versions accept an object literal, which is significantly faster and compliant with the ECMAScript standard. - Passing a JSON-Path to the
hasOwnProperty()method: ThehasOwnProperty()incorrectly treated its argument as a JSON-Path instead of a plain property name.