


MCP servers
The MCP servers page in AI observability lets you monitor MCP Server health, traffic, and tool execution across all published endpoints. Navigate to Monitor > AI observability > MCP servers to open the page.
MCP request data is captured automatically. No configuration is required to enable audit logging.
Snaplex nodes aggregate MCP data every minute and the data appears on the MCP servers page one or two minutes later. Use the time range selector at the top of the page to view data for 1h, 24h, 7d, or 30d, or select a custom date range.
Non-admin users can view data on assets for which they have at least read permission. Environment admins can view details about all assets in the environment (Org). All data is scoped to the current Org.
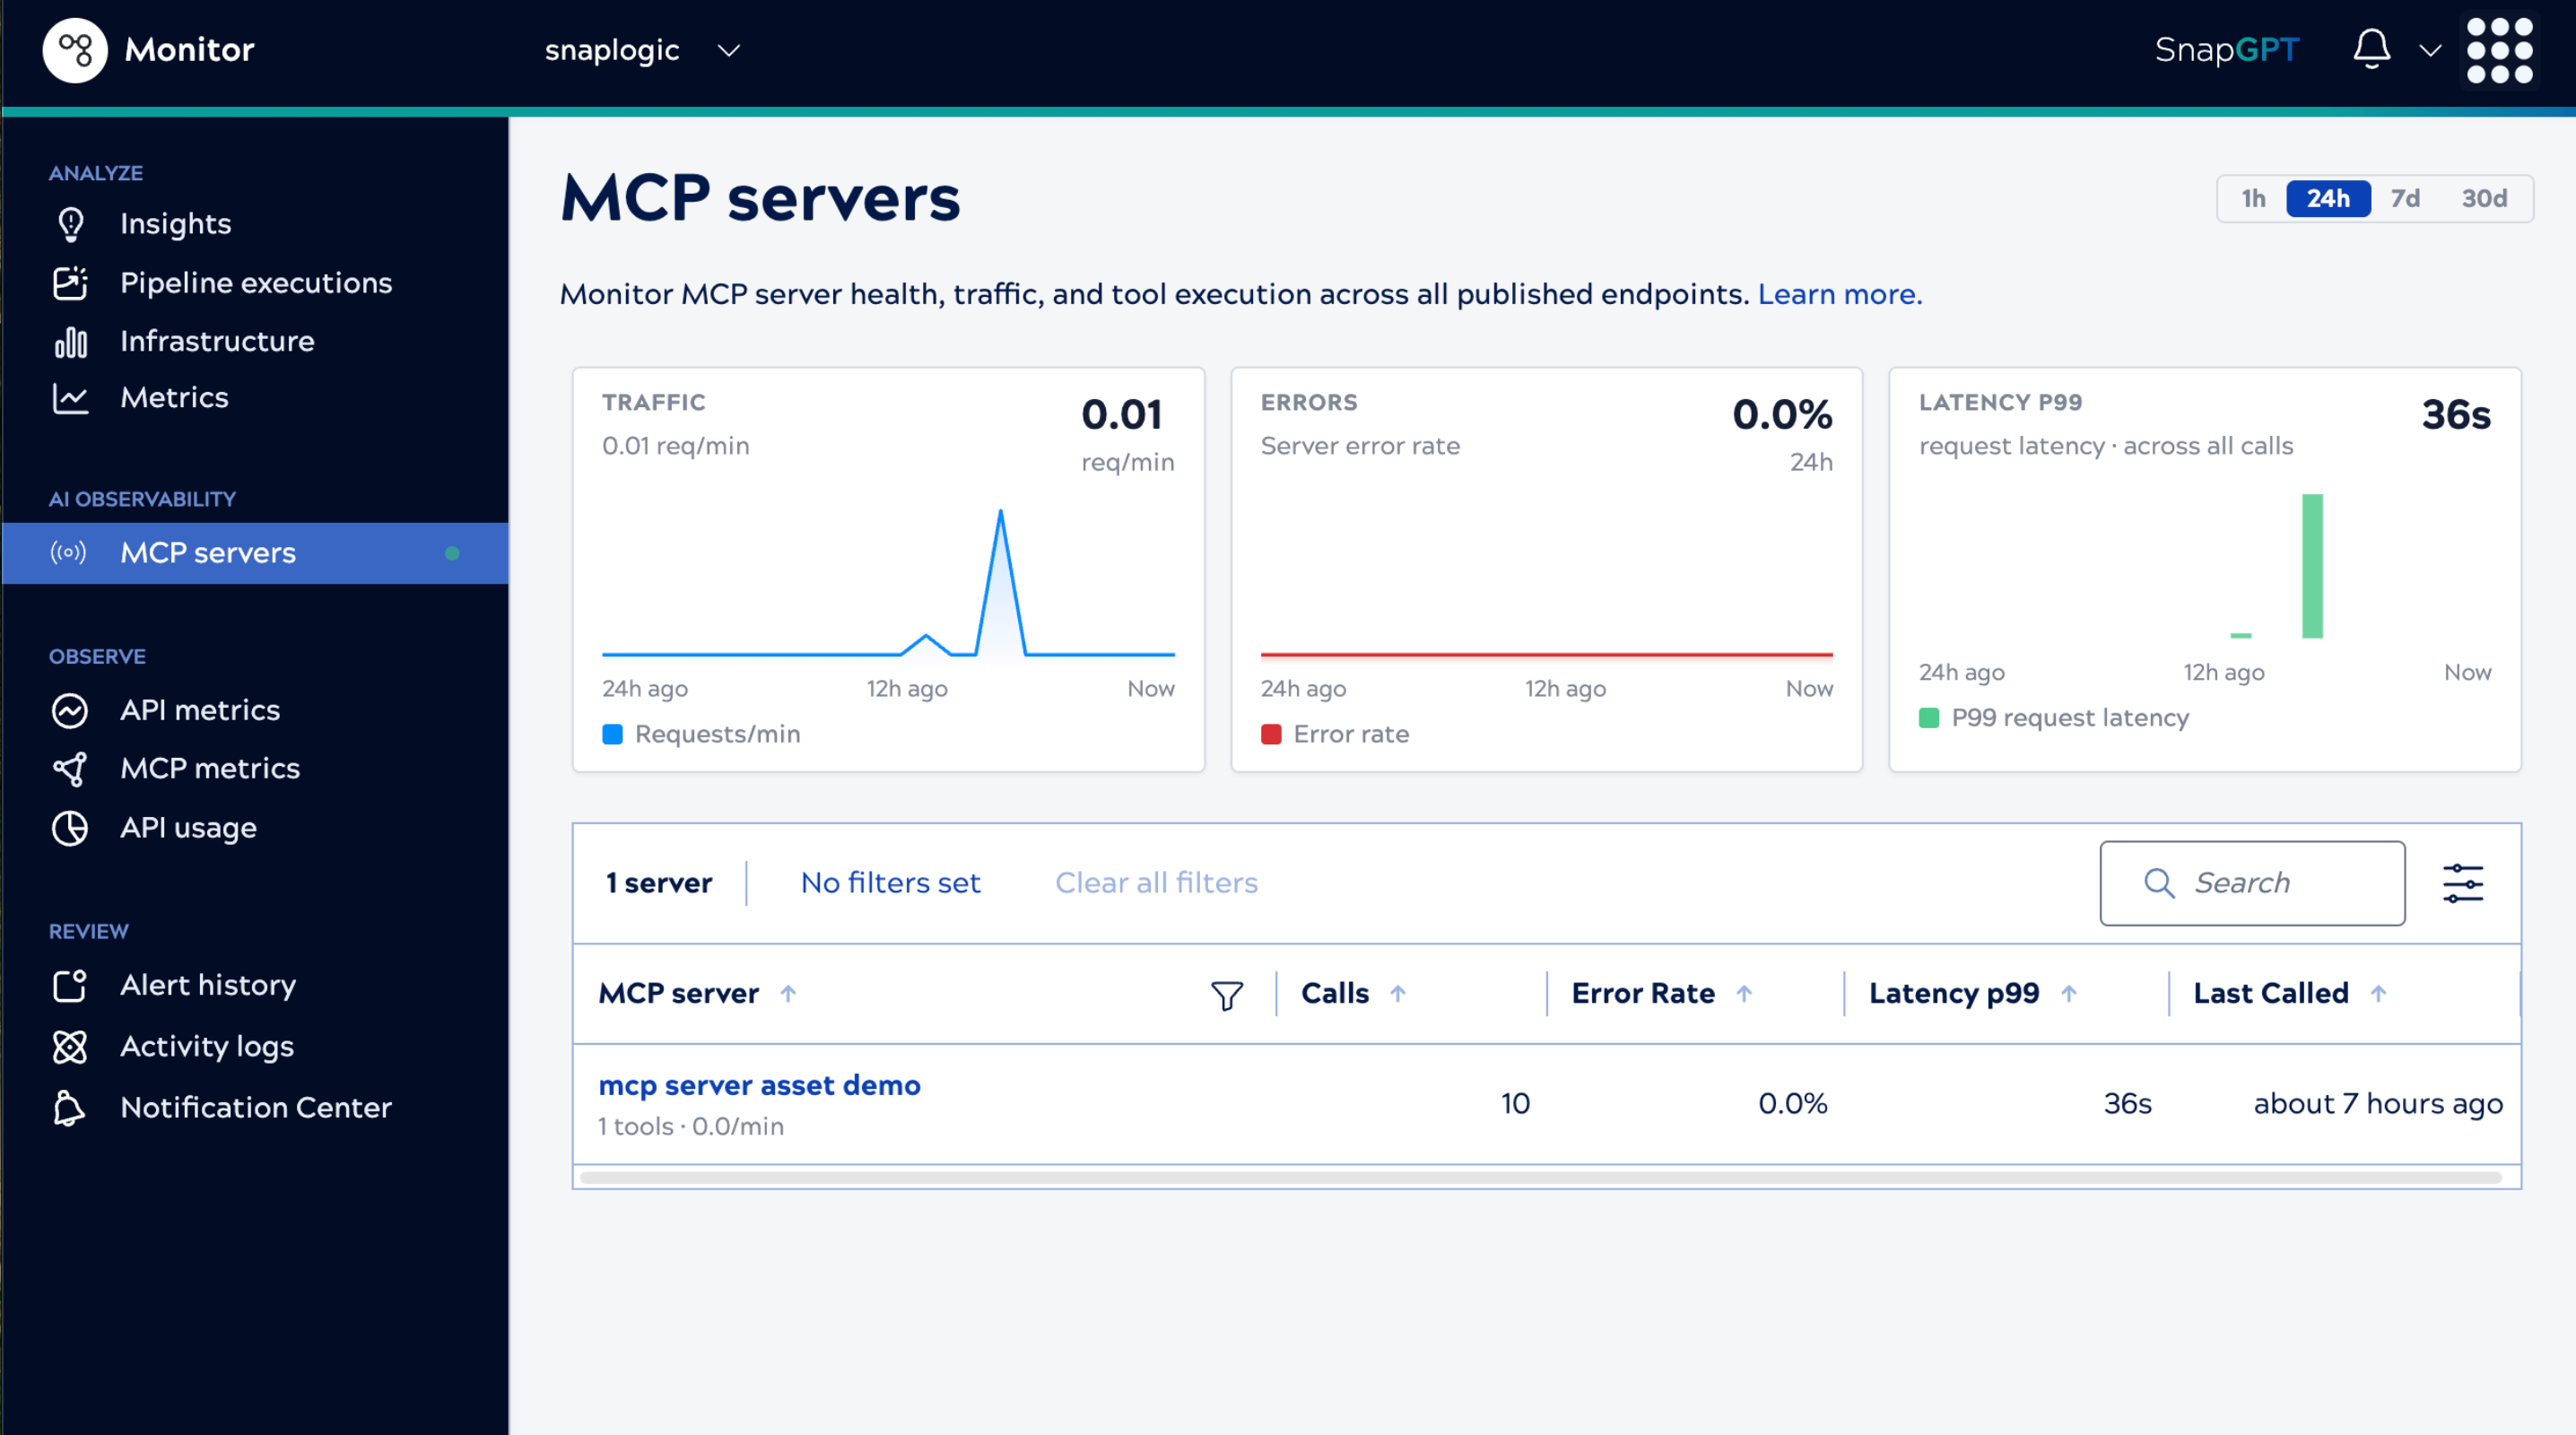
Dashboard cards
Three cards at the top of the page summarize MCP traffic across all servers in the current time range:
- TRAFFIC: A sparkline showing the number of MCP requests per minute.
- ERRORS: A sparkline showing the server error rate as a percentage of total requests.
- LATENCY P99: A bar chart showing the 99th percentile request latency in milliseconds across all MCP calls.
MCP Server list
The server list shows one row per MCP Server, sorted by calls (highest first) by default. Use the filter chips and search bar to narrow the list.
| Column | Description |
|---|---|
| MCP Server | The server name, the number of tools it exposes, and its current requests-per-minute rate. |
| Calls | The total number of MCP requests received by the server during the selected time range. |
| Error rate | The percentage of MCP requests that resulted in an error during the selected time range. |
| Latency p99 | The 99th percentile request latency for the server during the selected time range. |
| Last called | The timestamp of the most recent MCP request received by the server. |
Server detail
Click a row in the server list to open the server detail view. The header displays the server name and the following action links:
- Edit in Designer: Opens the server's pipeline in Designer.
- View execution: Opens the execution history for the server's pipeline in Monitor.
- Download logs: Downloads the request log for the server.
A summary metadata grid below the header shows the following fields:
- Path: The project path of the MCP Server asset.
- Server URL: The endpoint URL for the MCP Server.
- Server ID: The unique identifier for the MCP Server.
- Errors: The count of errors in the selected time range.
- Last called: The timestamp of the most recent request.
- Requests/min: The current request rate.
- Calls: The total request count in the selected time range.
- Auth: The authentication method configured for the server.
- Tools: The number of tools exposed by the server.
- Error rate: The error rate as a percentage.
- Latency p99: The 99th percentile latency.
The detail view contains two tabs: Tools and Requests.
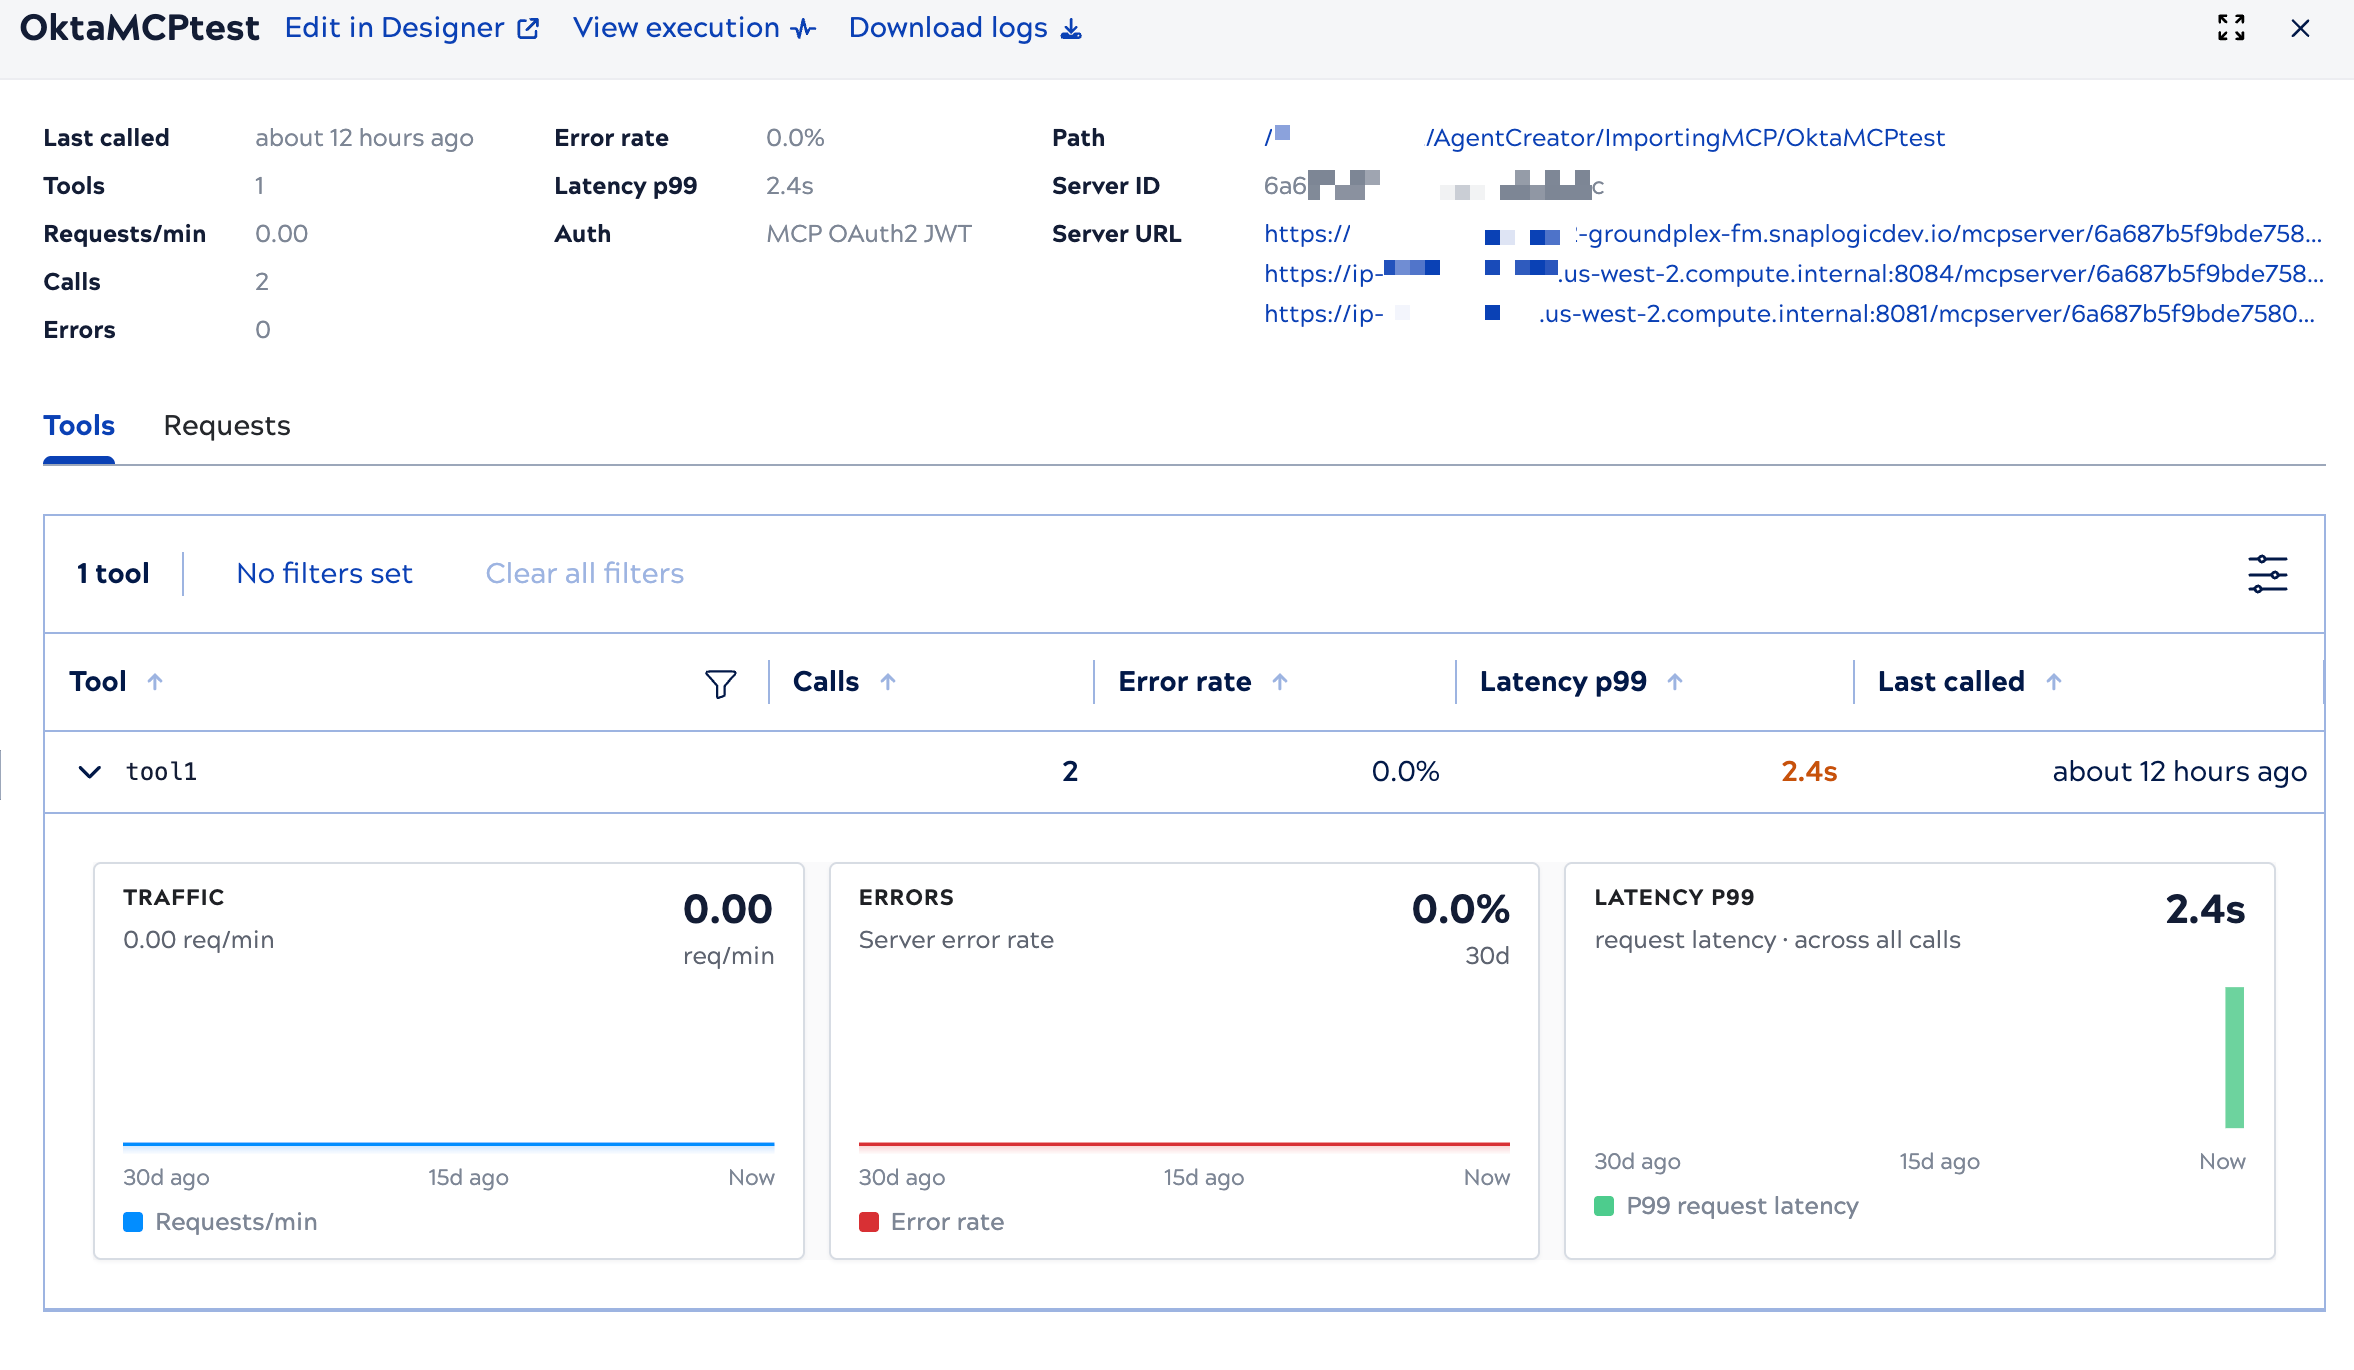
Tools tab
The Tools tab lists each tool exposed by the selected MCP Server. Expand a tool row to see per-tool mini charts.
| Column | Description |
|---|---|
| Tool | The name of the tool. |
| Calls | The number of times the tool was called during the selected time range. |
| Error rate | The percentage of calls to this tool that resulted in an error. |
| Latency p99 | The 99th percentile latency for calls to this tool. |
| Last called | The timestamp of the most recent call to this tool. |
Expanding a tool row reveals three mini charts scoped to that tool: TRAFFIC, ERRORS, and LATENCY P99.
Requests tab
The Requests tab shows the MCP request log for the selected server. The log is filterable and paginated.
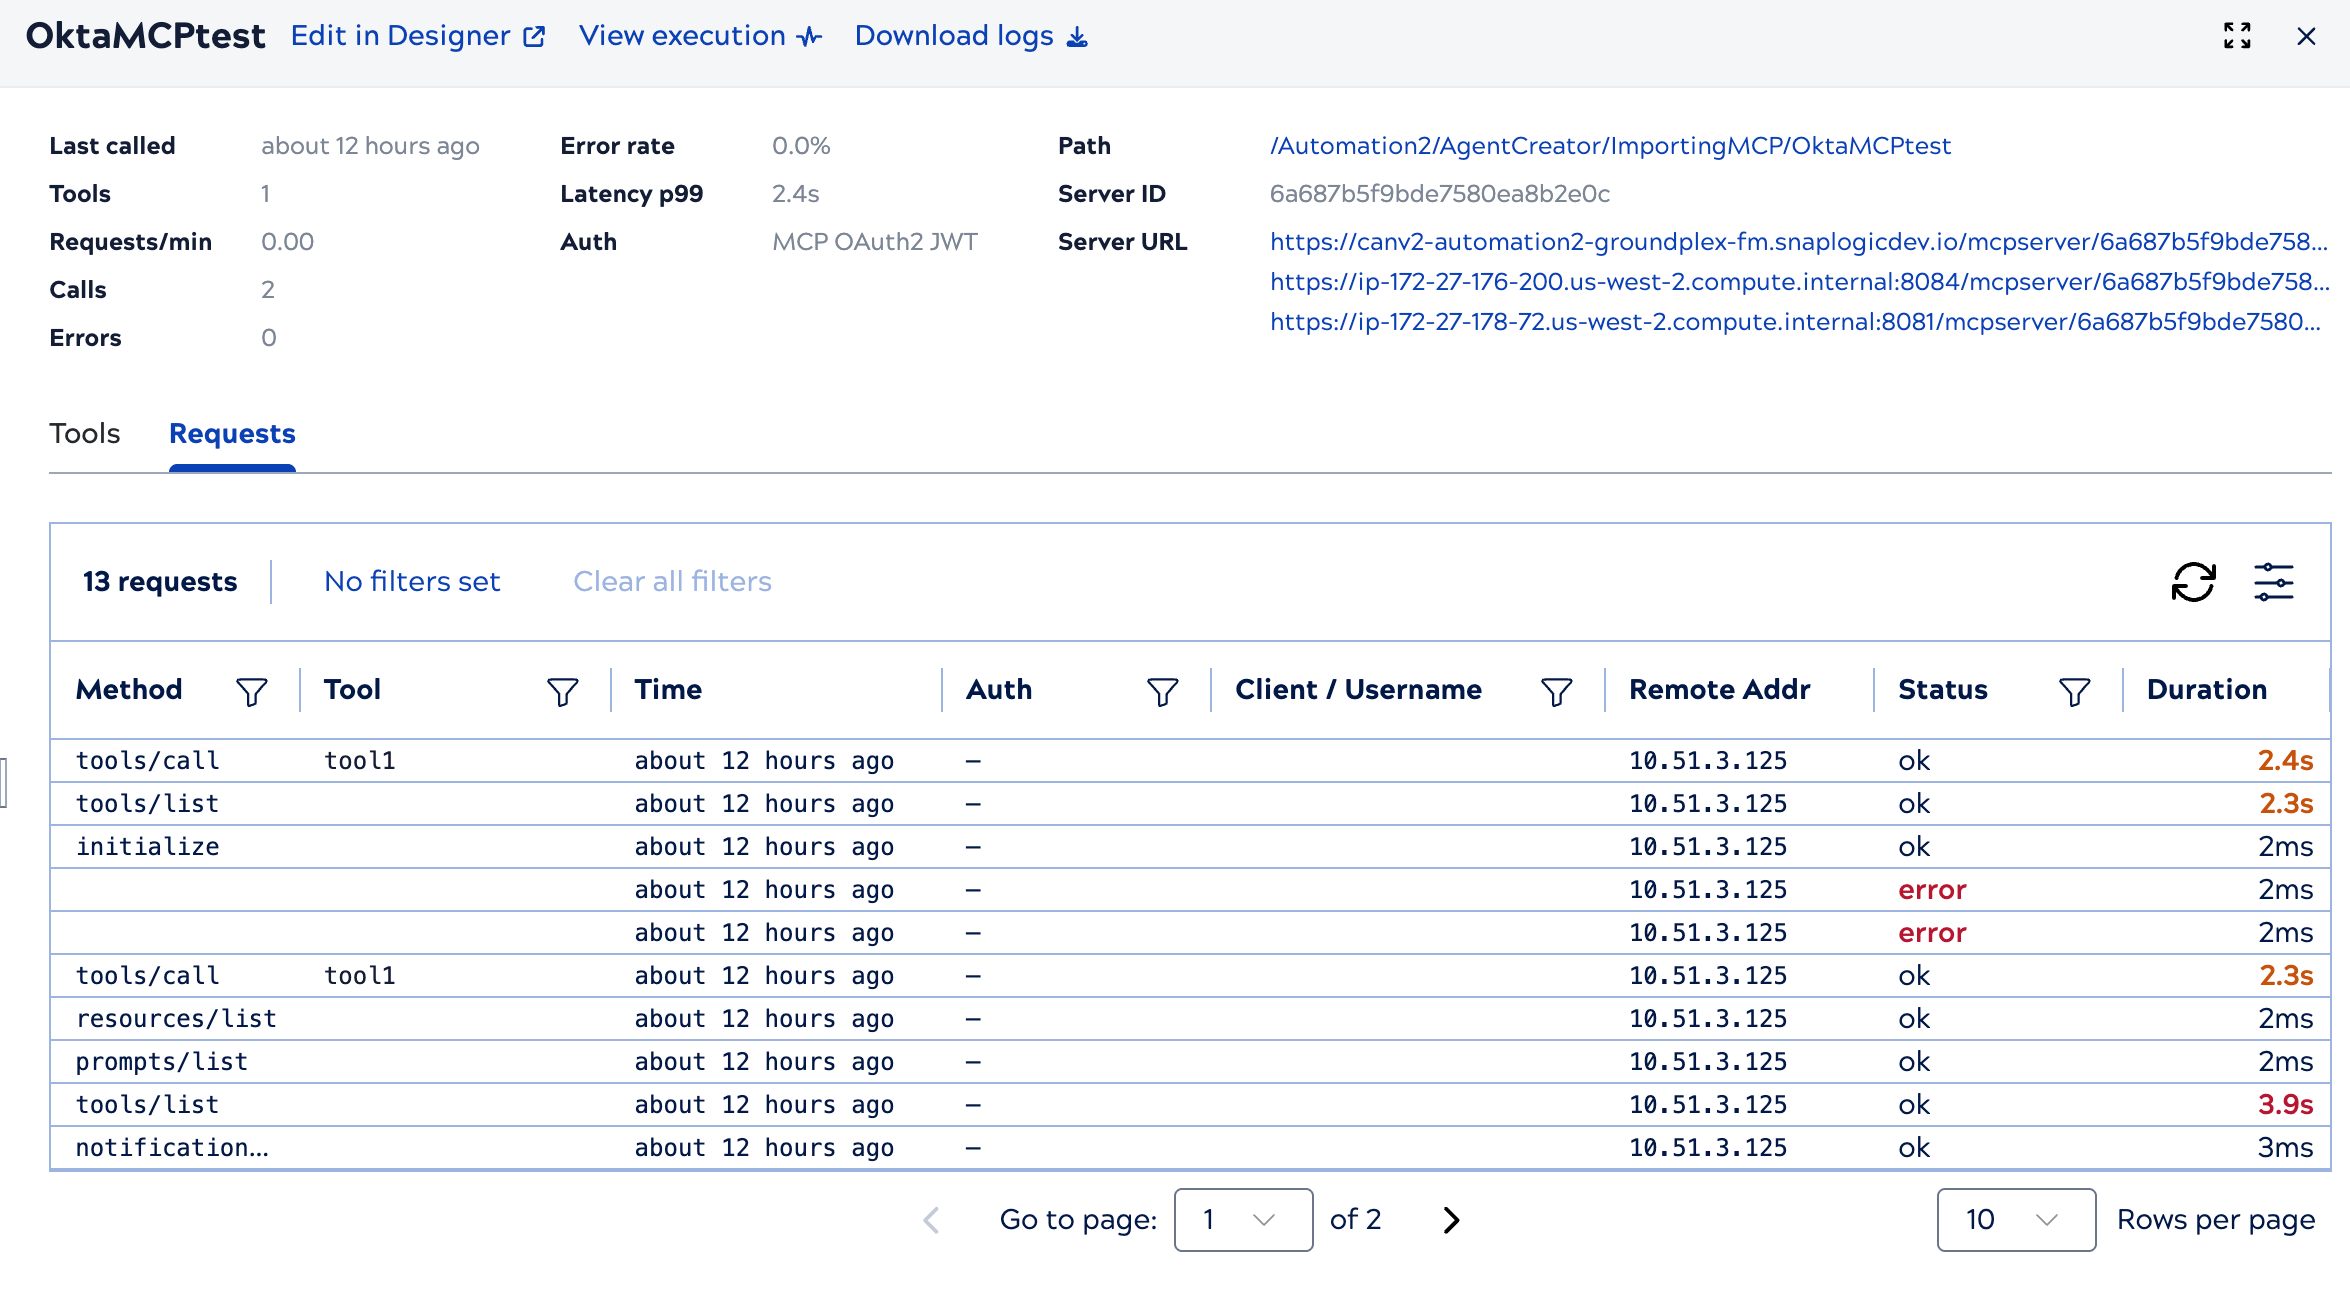
| Column | Description |
|---|---|
| Method | The MCP method name, such as tools/call. |
| Tool | The name of the tool invoked by the request. |
| Time | The timestamp when the request was received. |
| Auth | The authentication method used for the request. |
| Client/Username | The client identifier or the username used for authentication. |
| Remote Address | The IP address of the client that sent the request. |
| Status | The result status of the request. |
| Duration | The end-to-end latency for the request. |
Request detail
Click a row in the request log to open the request detail view. The following metadata fields are shown:
- Tool: The tool that was invoked.
- Method: The MCP method name.
- Client: The client identifier.
- Status: The result status of the request.
- Remote Address: The client IP address.
- Auth: The authentication method used.
- Received: The timestamp when the request was received.
- Latency: The end-to-end request latency.
Call payload
The Call payload section shows the request and response data:
- REQUEST: The
tools/callJSON sent by the client. - RESULT (on success): The JSON response returned by the pipeline.
- ERROR (on failure): The error type and message, joined in a single block.
Body payloads larger than 2,048 bytes are truncated and appended with
...[truncated].
Pipeline execution
The Pipeline execution section is expandable and shows pipeline execution details for the pipeline that handled the MCP request.
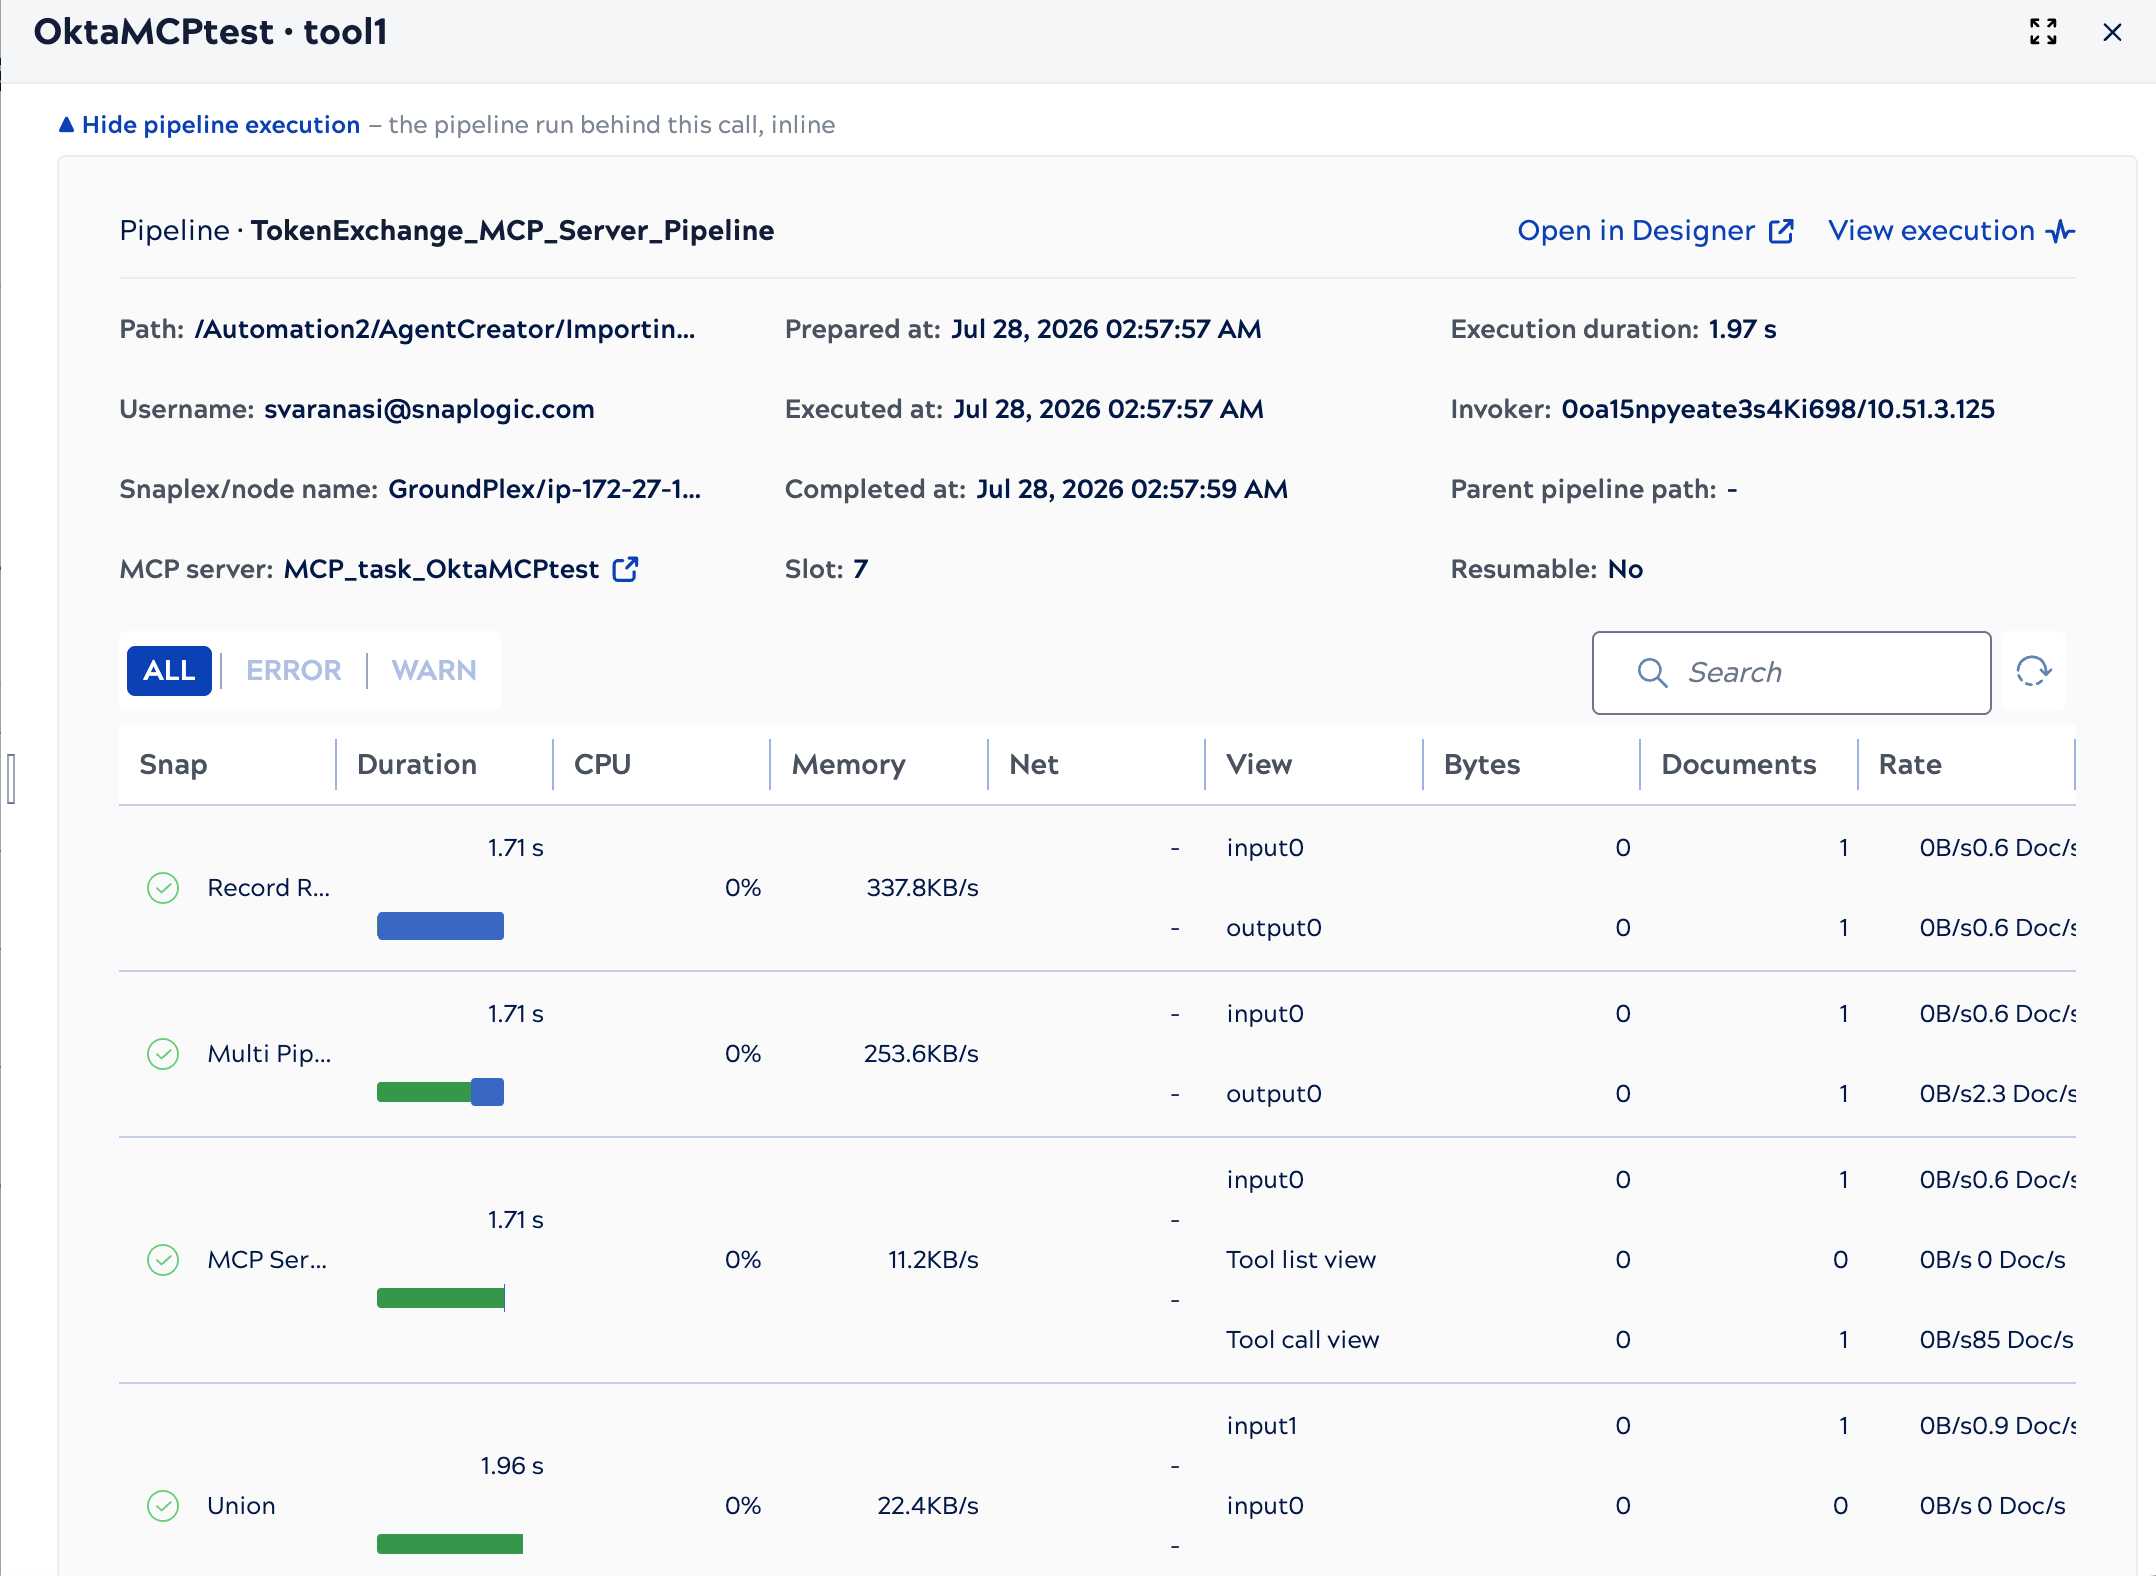
When pipeline execution details are available, the following fields are shown:
- Pipeline name and Path
- Username: The user that executed the pipeline.
- Snaplex and Node name
- MCP server: The MCP server that handled the request.
- Prepared at, Executed at, and Completed at timestamps
- Execution duration
- Invoker
- A Snap-level execution table with slot and per-Snap details
The section also includes Open in Designer and View execution links.
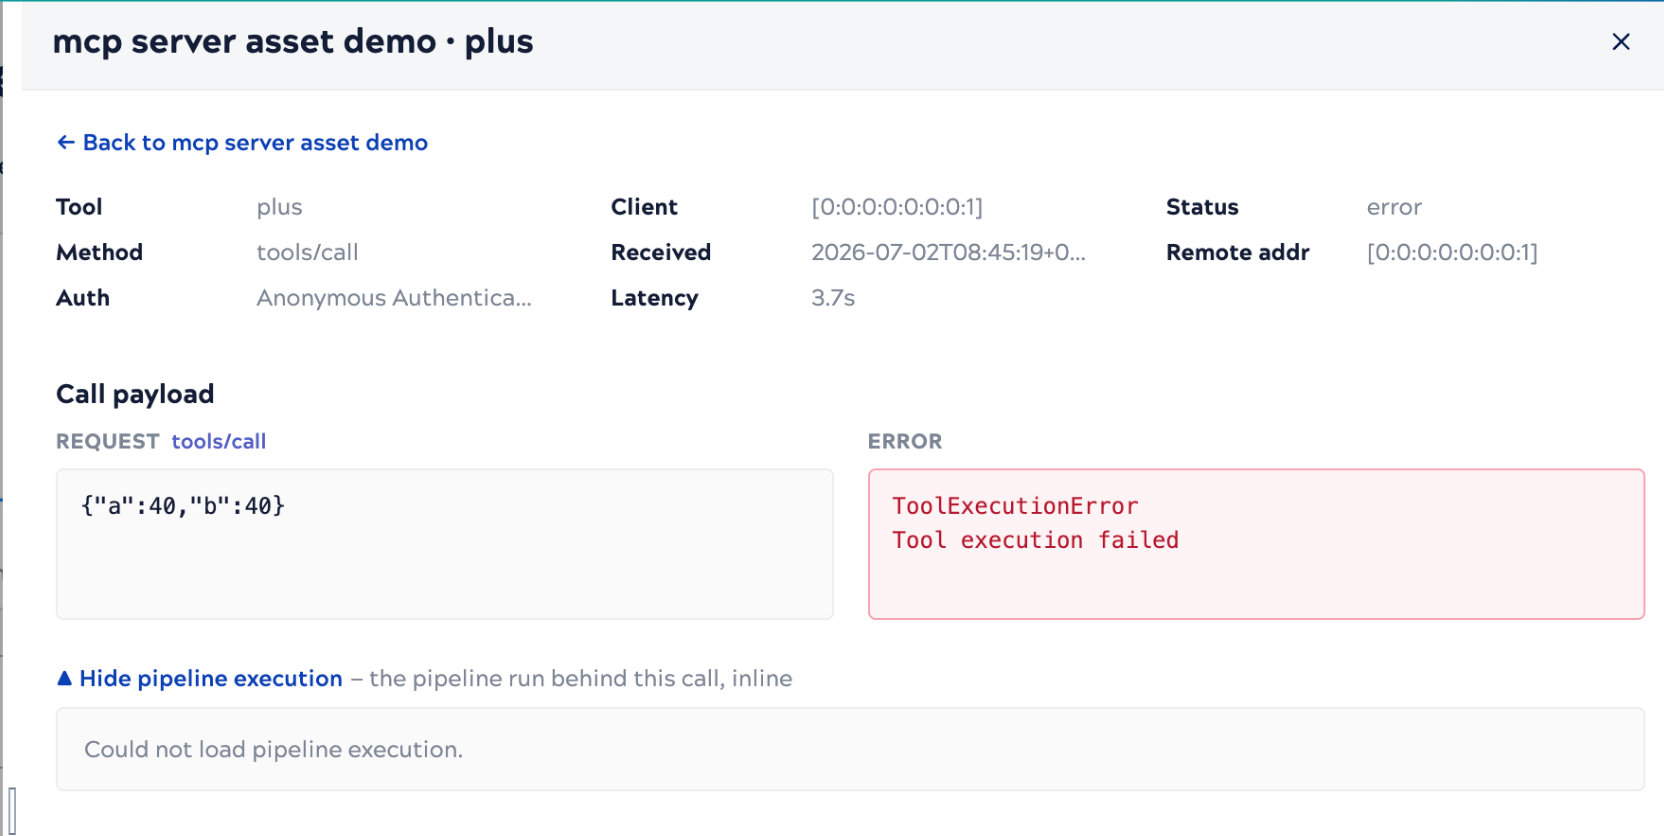
If pipeline execution details cannot be retrieved, the section displays Could not load pipeline execution.
tools/list requests display the request and result
JSON in the flyout but do not include a Pipeline execution
section because they do not invoke a pipeline. initialize requests appear in the log and open a flyout, but the
Request and Result fields are not populated with content.Bulk download logs
You can download the request logs for multiple MCP Servers at once from the MCP Server list. The download packages one CSV file per selected server into a single ZIP archive, scoped to the time range selected at the top of the page.
- On the MCP servers page, set the time range to the period you want to export.
- Select the servers to include. Use the checkbox in each row, or the header checkbox to select all servers in the list. The action bar shows the number of servers selected (for example, 3 selected).
- In the action bar, click Download logs. Your browser downloads a
ZIP archive named
mcp_audit_logs_<start>_<end>.zip, where<start>and<end>are the start and end of the selected time range. A confirmation message reports the number of servers included, for example, Downloaded logs for 3 servers.

ZIP file structure
The archive contains one CSV file per selected server, named after the server's asset ID
(for example, <asset-id>.csv). Each CSV includes the full set of
request-log columns, including the request arguments, output, and error message. The asset
ID is sanitized for use as a filename; if two sanitized asset IDs would collide, a numeric
suffix (_1, _2) is appended.
Empty logs and export errors
- No logs in the range: A selected server that has no requests in the time range is still included in the ZIP as a CSV that contains only the column header row.
- Partial failure: If the logs for some servers cannot be exported, the ZIP still
downloads with the successful servers. Each server that failed is represented by a
<asset-id>.error.txtfile in place of its CSV, describing the failure. - Total failure: If the export fails for every selected server, no ZIP is downloaded and the page displays Download failed. Please try again.
Download size limits
- You can include up to 50 servers in a single bulk download.
- Each server's CSV includes up to 100,000 log entries. If a server has more requests in the selected time range, only the most recent 100,000 are exported.
Limitations
- Body payloads over 2,048 bytes are truncated with
...[truncated]. - The
pipeline_run_idandcorrelation_idfields are populated only for Ultra Task execution paths. These fields may be blank for Triggered Task executions. initializerequests open a flyout, but the Request and Result fields are not populated with content.resources/readrequests are not yet captured.