Check Snaplex health
Use the SnapGPT Assistant to analyze the health of your Snaplexes over a selected time range and receive AI-generated insights about issues and suggested remediation.
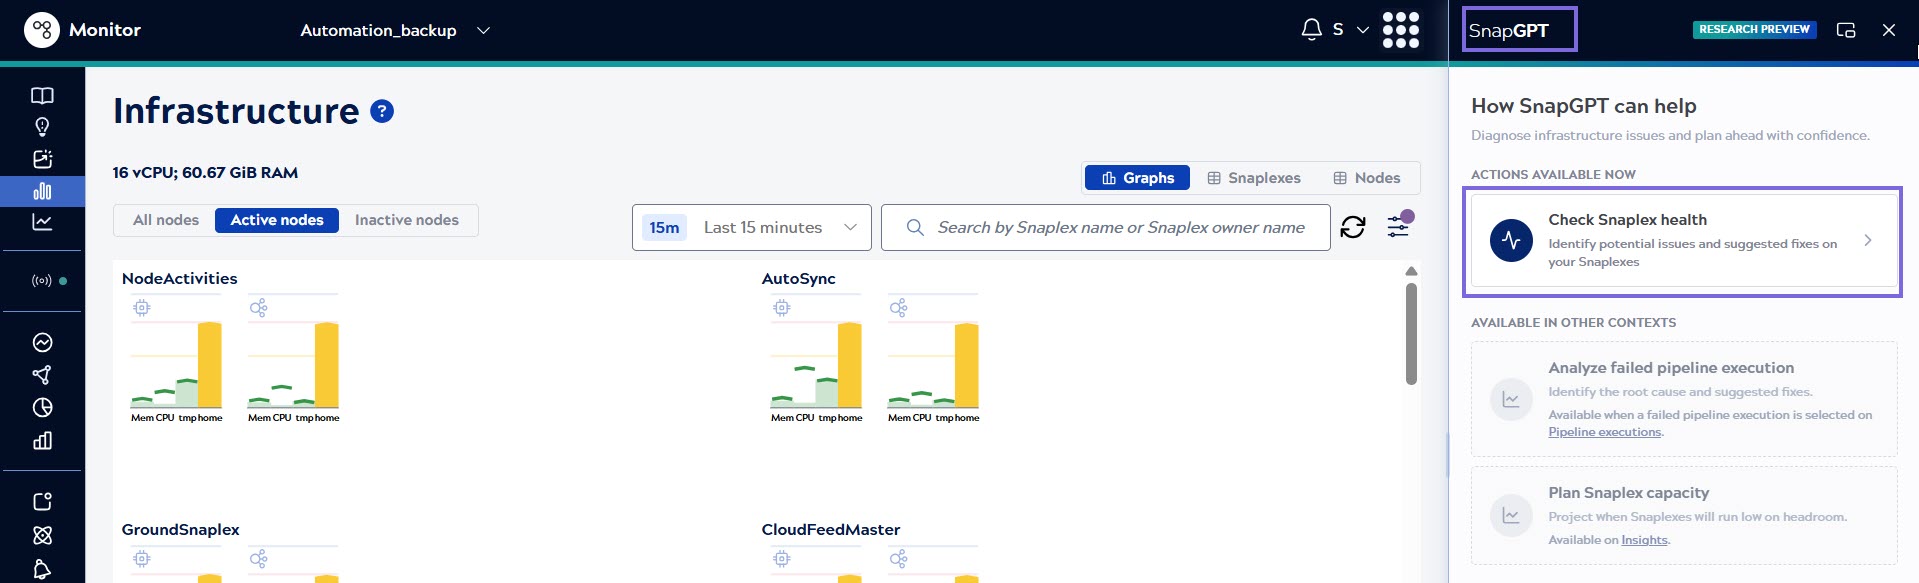
Use the SnapGPT Check Snaplex health skill on the Infrastructure page in Monitor to analyze Snaplex health including high resource utilization, crash events, node alerts and others for the time range you select. SnapGPT groups detected issues by Snaplex so you can quickly identify which nodes require attention and act directly from the panel.
-
The wizard guides you through four steps: Action, Time range,
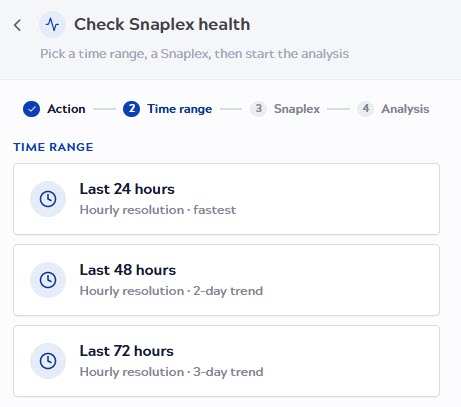
Snaplex, and Analysis. Select any of the following time ranges to
analyze:
- Last 24 hours: Hourly resolution, fastest.
- Last 48 hours: Hourly resolution, 2-day trend.
- Last 72 hours: Hourly resolution, 3-day trend.
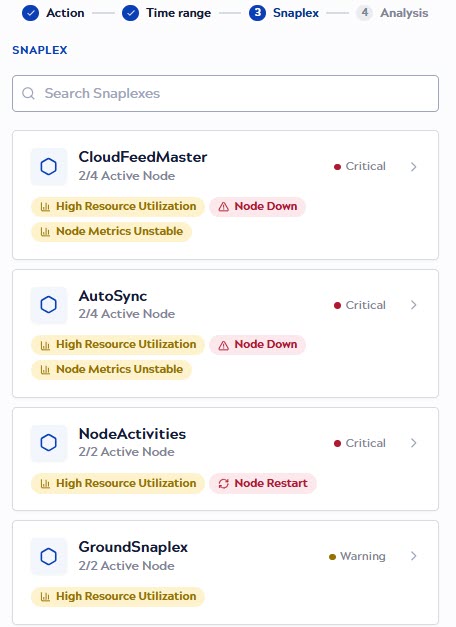
The wizard advances to step 3, Snaplex, and displays a list of Snaplexes in your environment.
-
In the Snaplex step, view all Snaplexes in a card format. Each
Snaplex card displays:
- The Snaplex name and the number of active nodes out of the total configured nodes.
- A health indicator: Critical, Warning, or Healthy on the Snaplex card.
- Snaplexes are sorted by severity: critical first, then warning, then healthy. Use the Search Snaplexes field to filter by name.
- The following issue types are shown as a chip on each of the Snaplex cards:
- Node Down: The control plane has not received a heartbeat from the node in the last 15 minutes.
- Node Restart: The node was restarted during the selected period.
- Node Alerts: One or more alerts were raised on the node.
- High Resource Utilization: Peak resource utilization exceeded the threshold.
- Node Crash: The node crashed at least once during the selected period.
- Node Interruption: One or more pipelines running on the node were interrupted during the selected period.
- Node Metrics Unstable: Some metrics are not available for the selected period, or the metric values are invalid.
-
Review the analysis view for the selected Snaplex.
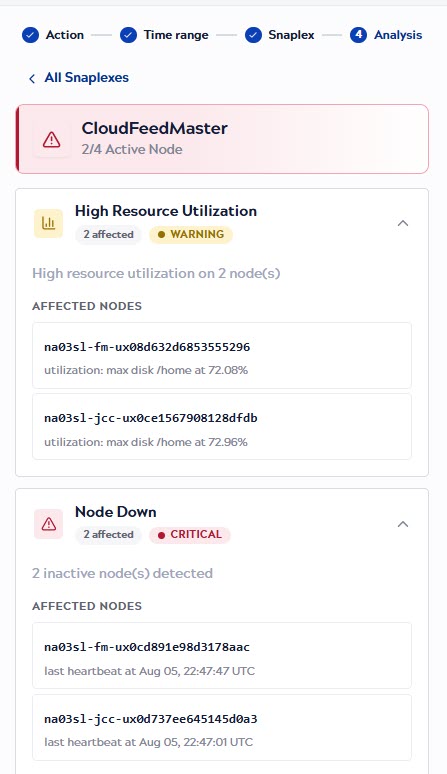
The top of the view shows a header card with the Snaplex name and active node count. Below it, issues are grouped by type, such as High Resource Utilization and Node Down. All issue groups are expanded by default. Click a group header to collapse or expand it. Each issue group displays:
- An icon identifying the issue type, the name of the issue type, and the number of affected nodes.
- A severity badge: CRITICAL or WARNING.
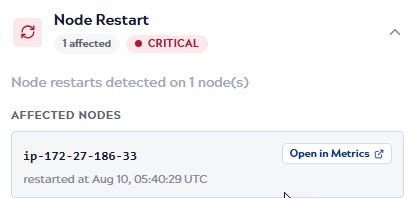
- A brief description of the condition detected. For example, Node restarts detected on 2 node(s) or 2 inactive node(s) detected.
- An Affected Nodes section listing each affected node by name,
with a status line specific to the issue type, such as:
- Node Restart: the timestamp of the last restart (for example, restarted at Jul 24, 08:12:07 UTC).
- Node Down: the timestamp of the last heartbeat received (for example, last heartbeat at Jul 18, 00:42:51 UTC).
- High Resource Utilization: the peak utilization percentage (for example, utilization: max disk /home at 72.64%).