


Pipeline execution statistics
The Pipeline execution statistics panel provides information about the pipeline status when a pipeline is executed or validated.
The Pipeline execution statistics panel provides information about the pipeline status when a pipeline is executed or validated. In this panel, click the pipeline name or click Open in Monitor to view additional information for the executed pipeline in Monitor.
You can view Pipeline execution statistics from the following locations:
- In Designer, click the Pipeline statistics
 icon
for an executed or validated pipeline.
icon
for an executed or validated pipeline. - In Monitor, click Pipeline executions.
In the Pipeline name column, click the pipeline link, or
click the three-dot menu in the pipeline row and select View execution
details. The Snap statistics tab is selected by default.
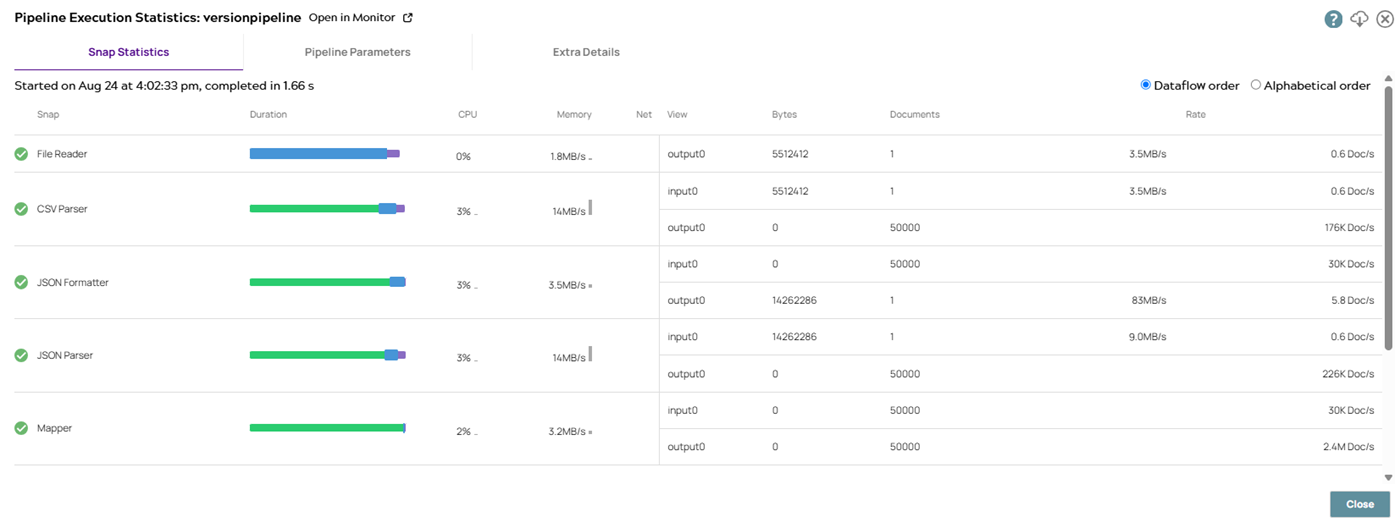
- Click Open in Monitor to view additonal information for the executed pipeline.
- Click the Download
 icon to download logs or full runtime dump. Download logs
only exports the Pipeline logs tab content as a JSON file.
Download full runtime dump exports all runtime data,
including Snap statistics, logs, pipeline parameters, and state transition as a
ZIP file.
icon to download logs or full runtime dump. Download logs
only exports the Pipeline logs tab content as a JSON file.
Download full runtime dump exports all runtime data,
including Snap statistics, logs, pipeline parameters, and state transition as a
ZIP file.
Pipeline execution statistics panel
The Pipeline execution statistics panel contains the following tabs:
Snap Statistics
Owners of child pipelines can access runtime logs and Snap statistics of parent pipelines if one or more of the following is true:
- They also own the parent pipeline.
- They have read permissions to the project containing the parent pipeline. Learn more: Assigning Permissions to a Project.
| Column | Description |
|---|---|
| Snap | The Snap name in the pipeline. Learn more about Snap indicators and states. |
| Duration | A bar chart that shows how long the pipeline takes to
process each document. The width of the chart represents the
Snap's overall run time, broken into three color-coded sections:
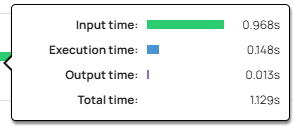 Input
and output times measure how long the Snap waits on its
neighboring Snaps to finish their processing, while
execution time measures how long the Snap itself spends
processing documents. Hover over the
Duration bar to view the
exact time the Snap spent waiting or executing. When
optimizing a pipeline, look for Snaps with a large blue
bar to identify bottlenecks. Note: Ultra pipelines have
an additional Idle metric
that indicates how long the pipeline has been idle
and not processing any documents. The idle time is
subtracted from the input wait time to indicate
where bottlenecks are located in an Ultra
pipeline. |
| CPU | The amount of CPU time the Snap consumed. |
| Memory | The amount of memory the Snap allocated. |
| Net | The volume of data the Snap sent or received over the network. |
| View | Statistics for each view that accepts or produces documents. |
| Bytes | The total data that has passed through the view. Populated for Snaps that have binary views. |
| Documents | The number of structured or binary documents that flowed
through the view. Note: Binary views can send multiple
documents. For example, a ZipFile Reader Snap outputs a
separate binary document for each file in the
Zip. |
| Rate | A rough approximation of how quickly documents flow through the view. If the Snap has binary views, the byte rate is also displayed. |
If you see high resource usage on your Snaplex node, use these metrics to identify potential causes.
| Additional resource usage | Pop-up |
|---|---|
|
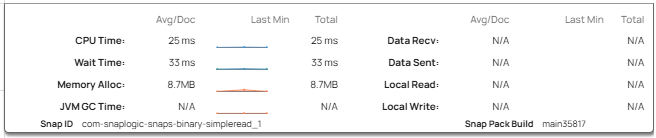 |
The Memory Allocated value does not reflect memory that was freed, so it does not represent the peak memory usage of the Snap. Do not rely on this metric to estimate the required size of a Snaplex node. Instead, use it as an insight into how much memory was allocated to process all documents. For example, if the total allocated was 5MB and the Snap processed 32 documents, the Snap allocated roughly 164KB per document. Combined with the other statistics, this helps identify potential causes of performance issues.
Caveats for network usage statistics:
- During validation, preview data written to SnapLogic cloud servers may also appear in these statistics. During a regular execution, that transfer is not recorded.
- Only Linux nodes are supported (Windows is not supported).
- Snaps that use an external program to transfer data, such as some database bulk loaders, do not show any network usage.
The Snap Statistics tab uses inline indicators to display issues and completion state:
- If the pipeline fails, the failing Snap is highlighted inline in the
panel.

- If a Snap writes to its error view, the row is highlighted in red.

- Warnings appear on Snaps when a potential issue needs attention. For example, pipelines using a deprecated Snap version display a warning.
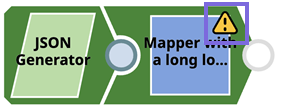
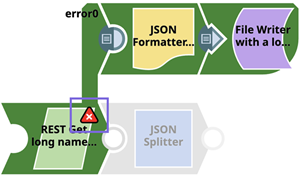
When you execute a pipeline on the Designer canvas, you can view execution status icons on the pipeline:
| Warnings: When a Snap encounters warnings, the warning icon displays on the Snap. |
 |
| Errors: When a Snap encounters errors, the error icon displays on the Snap. |
 |
Pipeline parameters
This tab displays parameter values captured during execution. It only displays information for those pipelines that are run either by a task or by another Snap (such as the pipeline Execute Snap). Values are returned only for those parameters that have Capture selected in the pipeline Properties dialog.
Extra Details
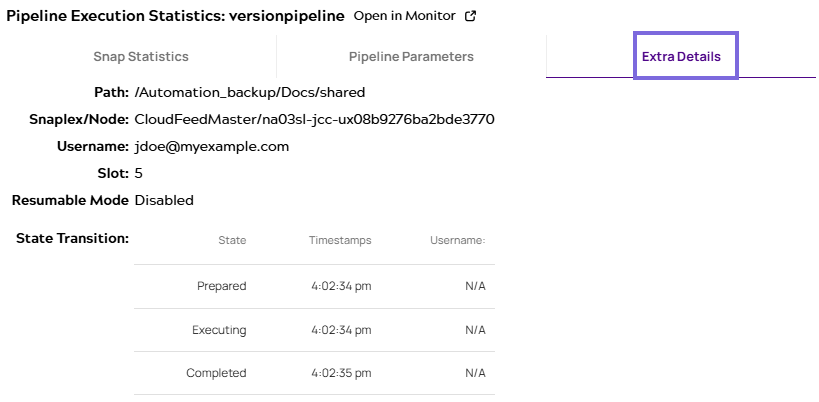
The execution time in Snap Statistics may differ from the time in Extra Details. For example, Snap Statistics may show 2.30 minutes while Extra Details shows a range from Jan 25 at 1:37:54 am to Jan 25 at 1:40:12 am.
The Snap Statistics time includes a fractional component that represents a portion of a second. In this example, 0.30 translates to 30/100 * 60 = 18 seconds, so the actual execution time is 2 minutes and 18 seconds, which aligns with the Extra Details tab.
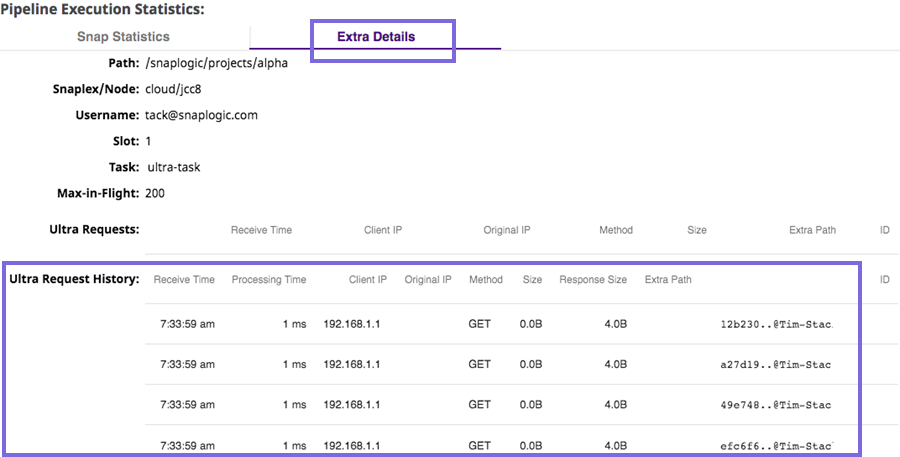
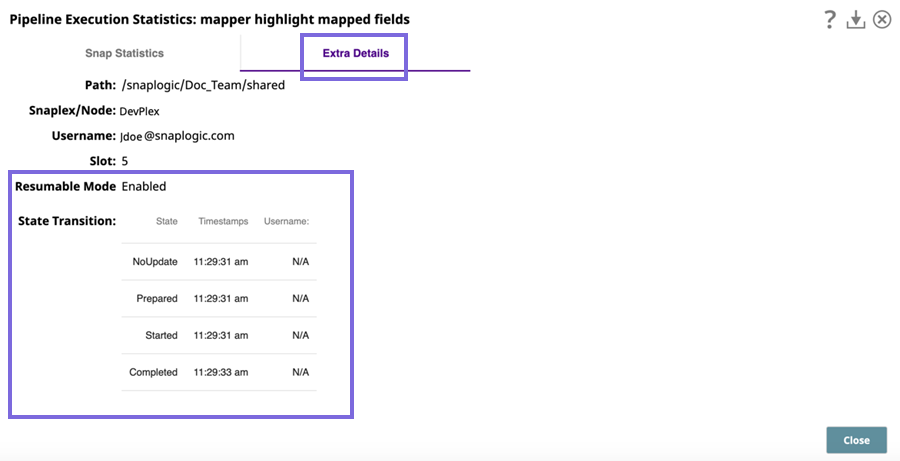
The Extra Details tab provides the following information about the pipeline run:
- Path: Path to the pipeline.
- Snaplex/Node: The Snaplex node used to run the pipeline.
- Username: The username of the person who ran the pipeline.
- Slot: See Maximum Slots on the Node Properties tab of the Update Snaplex dialog.
- Resumable Mode: Displays as Enabled if the pipeline is resumable; otherwise Disabled.
- Task name: Name of the Task, if applicable.
- Max-in-Flight: The maximum number of documents that can be processed by an Ultra task instance at any one time.
- Close reason: Displayed when an Ultra task enters the Completed state.
- Stop Reason: Displayed when the system cannot stop the
pipeline on the node because the runtime cannot be found. The runtime status is
set to Stopped, but the displayed execution duration may
not be accurate. The possible execution duration is shown in milliseconds.
- Reference no longer exists or is inaccessible.
- Host Snaplex node has restarted.
- The Ultra task has been updated.
- The task is no longer active.
- Closing Ultra pipeline instance to balance instances across the Snaplex.
- Ultra Requests: These statistics display during document processing for Ultra pipelines:
- Receive Time: The time that the request is received.
- Client IP: The IP address that the FeedMaster sees when the load balancer forwards a request.
- Original IP: The IP address of the external client that the load balancer forwards to the FeedMaster, when configured to do so.
- Method: The underlying HTTP method of the request.
- Size: The size of the document payload in bytes.
- Extra Path: The path of the Ultra pipeline task.
- The Request History for Ultra Tasks: Displays the last
100 documents processed in the Ultra pipeline.
 Note: Some statistics are identical to those in the Ultra Requests report.
- Receive Time: The time that the request is received.
- Processing Time: The total time for the Ultra pipeline to process the documents associated with this request. For example, if the input document is copied, this time includes all the time needed to process each copy.
- Client IP: The IP address that the FeedMaster sees when the load balancer forwards a request.
- Original IP: The IP address of the external client that the load balancer forwards to the FeedMaster, when configured to do so.
- Method: The underlying HTTP method of the request.
- Size: The size of the document payload in bytes.
- Response Size: The size of the document payload inside the response, in bytes.
- Extra Path: The path of the Ultra pipeline task.
- State Transition: These statistics display when multiple
runs of an Ultra pipeline occur:
- State: The current state of the Ultra pipeline.
- Timestamps: The time that the most recent Ultra pipeline execution occurred.
- Username: The username of the person invoking the Ultra pipeline.