


Interface Overview
The SnapLogic Platform provides three primary interfaces for designing, managing, and monitoring your data integrations.
Overview
The SnapLogic Platform provides a unified interface for building, deploying, and managing data integrations. The platform consists of three main interfaces, each optimized for specific tasks in your integration lifecycle:
- Designer – Build and configure pipelines
- Project Manager – Manage projects, assets, and permissions
- Monitor – Track execution and monitor infrastructure health
Access all three interfaces from the waffle menu located in the upper-right corner of the SnapLogic Platform.
Designer Interface
Designer is the primary interface for building integration pipelines. Use Designer to drag Snaps onto the canvas, connect them together, and configure each Snap's settings to define your data flow.
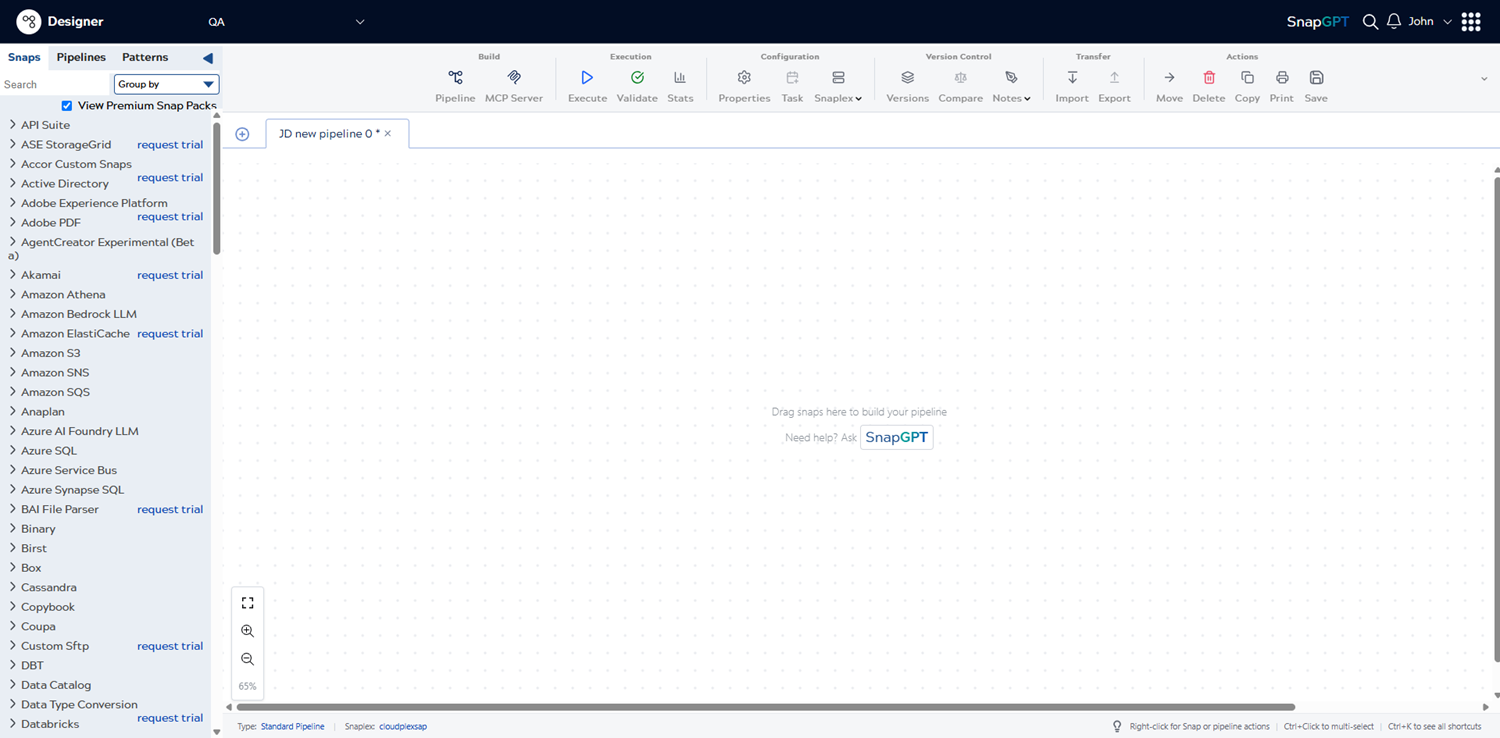
Key components of the Designer interface include:
- Snaps Catalog (left panel) – Browse and search available Snap Packs and Snaps. Core Snaps are available in all environments, while Premium Snaps require a subscription.
- Canvas (center) – The workspace where you build pipelines by dragging Snaps and connecting them together.
- Designer Toolbar (top) – Access controls for pipeline execution, validation, properties, tasks, version control, and more.
- Properties Panel (right) – Configure individual Snap settings, including credentials, field mappings, and execution options.
The Designer Toolbar provides quick access to common operations organized into functional groups:
- Build – Create new pipelines or configure MCP servers
- Execution – Run, validate, and view statistics for pipelines
- Configuration – Set pipeline properties, create tasks, and select Snaplexes
- Version Control – Manage pipeline versions, compare changes, and add notes
- Transfer – Import and export pipeline files (
.slpformat) - Actions – Move, copy, delete, print, and save pipelines
For more information, refer to Designer Interface.
Project Manager Interface
Project Manager provides the interface for organizing and managing your integration assets. Use Project Manager to create project spaces, set permissions, and manage assets such as pipelines, accounts, files, and schemas.
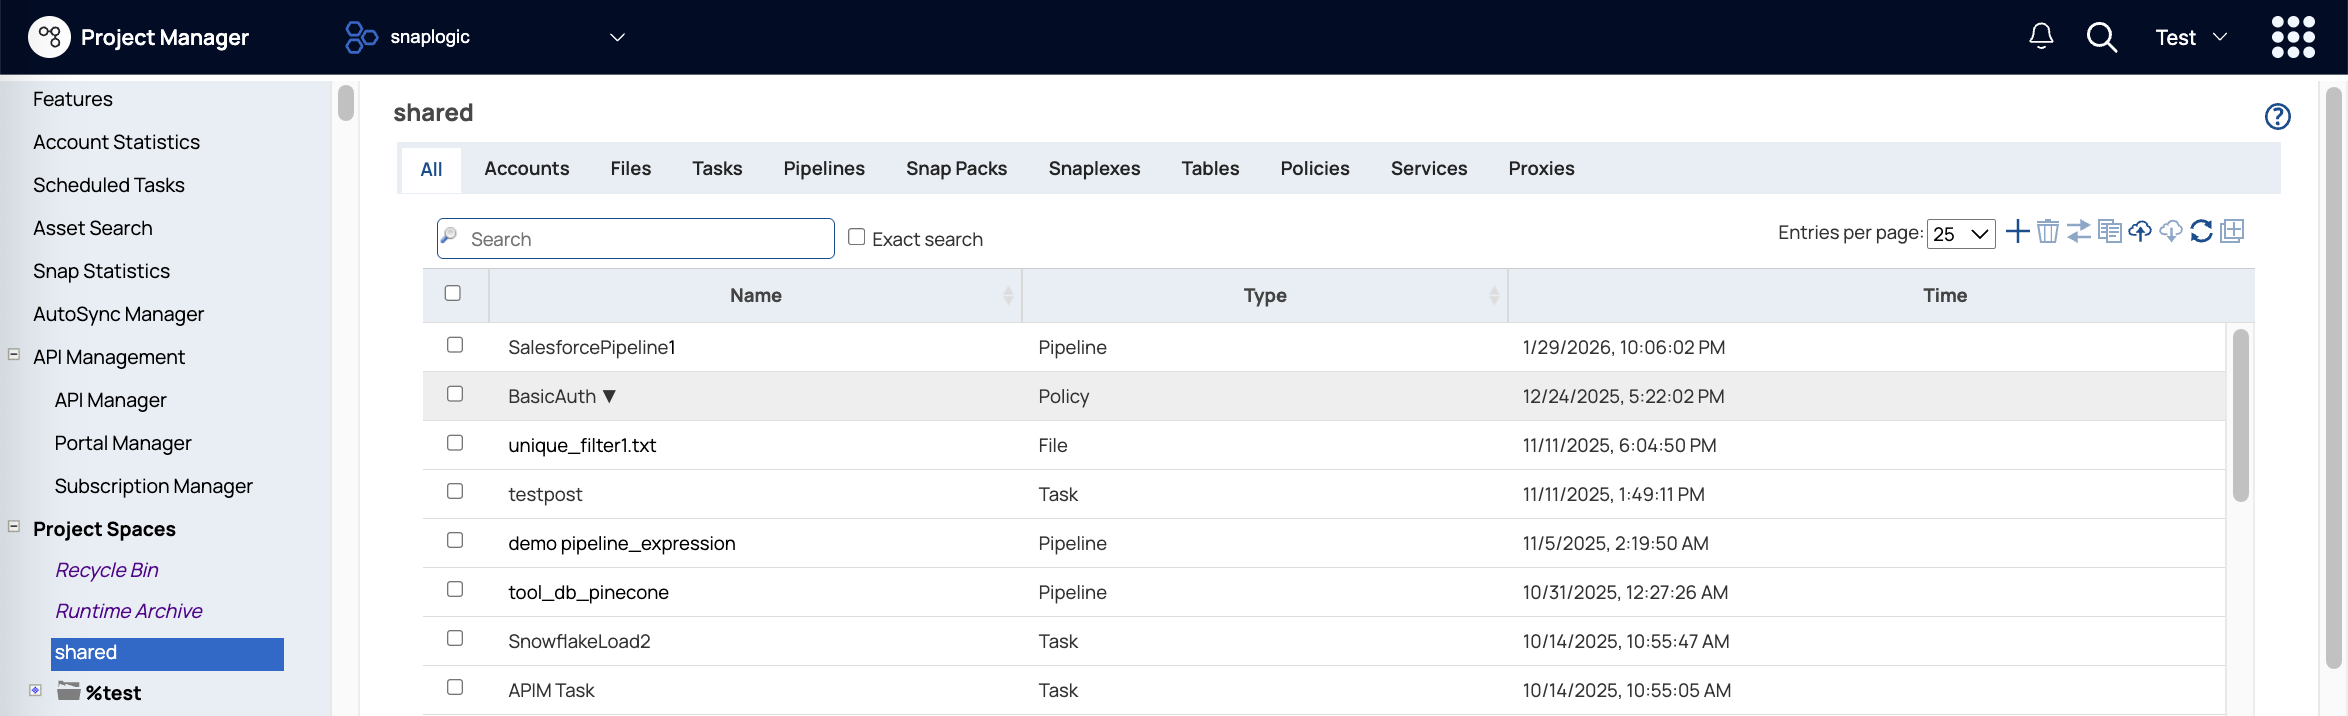
Key components of the Project Manager interface include:
- Navigation Tree (left panel) – Hierarchical view of project spaces, projects, and the shared folders. The global shared folder contains assets accessible from all projects in your environment.
- Asset View (center) – List or grid view of assets in the selected project or folder, including pipelines, accounts, files, schemas, and more.
- Details Panel (right) – View metadata, permissions, and properties for selected assets.
- Search and Filter (top) – Search for assets by name, type, or other criteria across your environment.
Project Manager enables Environment admins to:
- Create and manage project spaces to organize related projects
- Set permissions at the project space, project, or asset level
- Manage user and group access with Read Only, Read & Write, Read & Execute, or Full Access permissions
- Transfer projects and assets between environments using export, migration, or the Git Integration
For more information, refer to Project Manager.
Monitor Interface
Monitor provides visibility into pipeline executions, infrastructure health, and system activity. Use Monitor to troubleshoot pipeline errors, track resource usage, and analyze performance metrics.
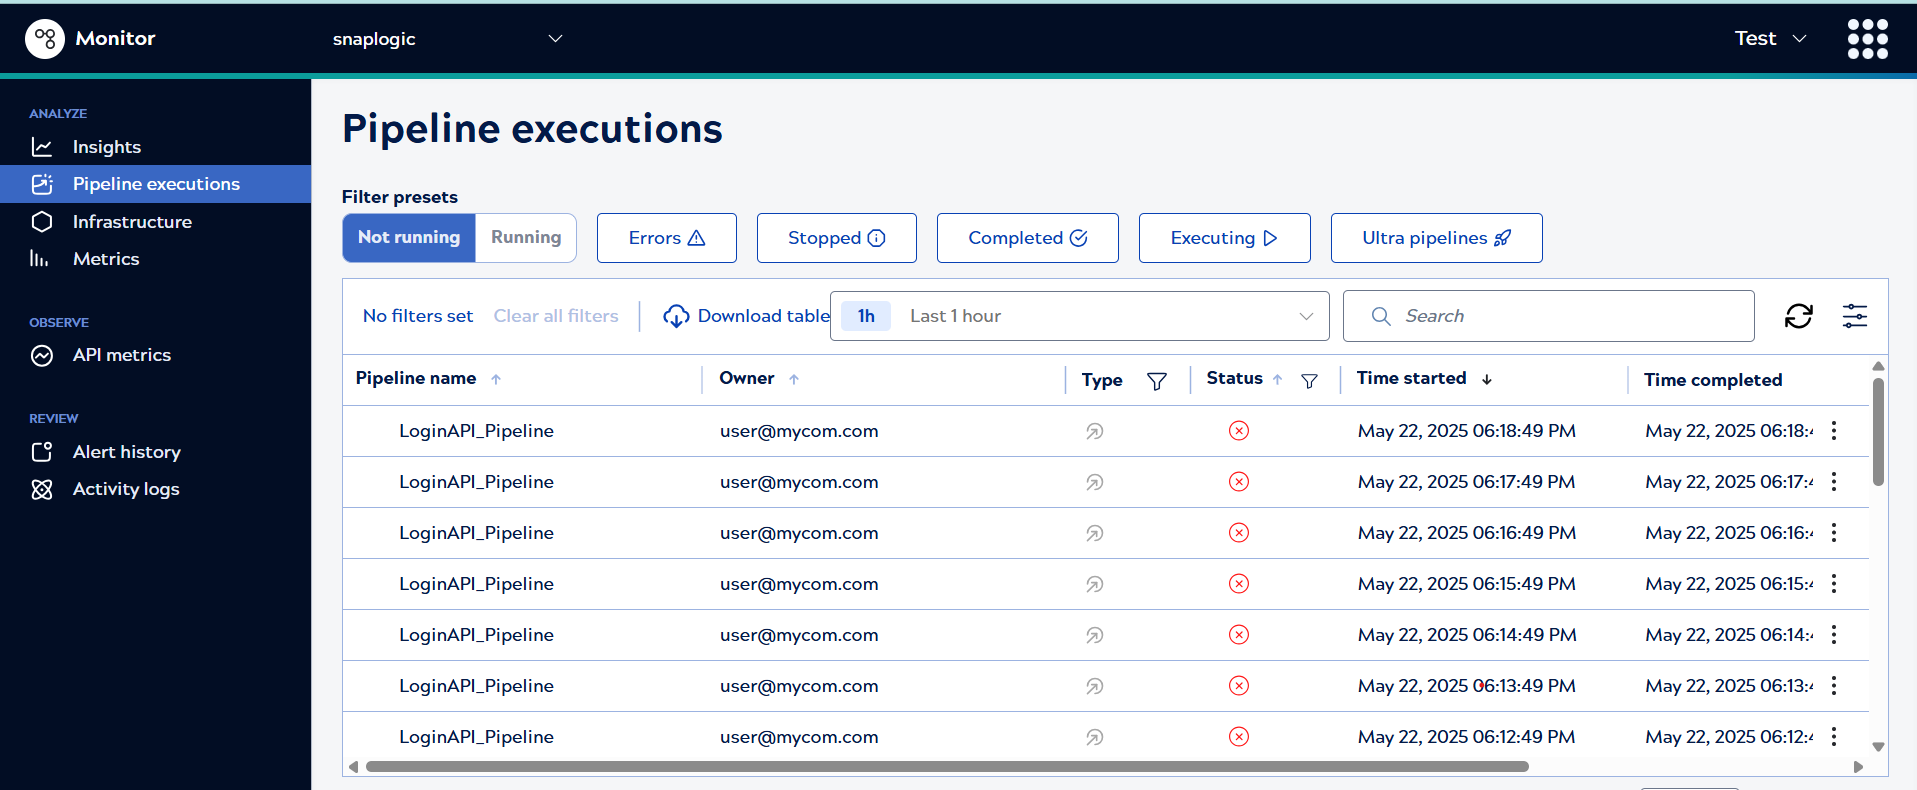
Key components of the Monitor interface include:
- Navigation Menu (left panel) – Access different monitoring pages including Pipeline executions, Infrastructure, Metrics, Activity logs, and Alert history.
- Data View (center) – Tables, charts, and graphs displaying execution data, resource metrics, or system events.
- Filters and Time Range (top) – Narrow results by project, Snaplex, time period, status, or other criteria.
- Details Panel (expandable) – View execution details, error messages, logs, and Snap-level statistics.
Monitor provides several specialized views:
- Asset Catalog – Metadata summary for all operational pipelines, tasks, and accounts
- Insights – High-level statistics on users, sessions, pipelines, Snaps, and documents processed
- Pipeline Executions – Records of completed and in-progress pipeline runs with detailed error and log information
- Infrastructure – Resource utilization for Snaplexes and their nodes
- Metrics – Time-series charts of CPU, memory, disk, and network usage
- Activity Logs – System notifications and user activity events
- Alert History – Snaplex node alerts and health warnings
- Notification Center – Configurable alerts for pipeline failures, Snaplex issues, and custom conditions
For more information, referto Monitor.
Additional Interfaces
Beyond the three primary interfaces, the SnapLogic Platform includes specialized interfaces for advanced features:
- Admin Manager – Environment configuration, user management, Snaplex administration, and security settings (Environment admins only)
- API Management Dashboard – Create, publish, and manage APIs from your integration pipelines (requires APIM subscription)
- AutoSync – Configure automated data synchronization between applications (requires AutoSync subscription)
- Pattern Library – Browse and use pre-built integration templates for common use cases