


Pipeline metrics use cases
Worked monitoring scenarios that show how to combine pipeline lifecycle metrics, tags, and dashboard queries to troubleshoot, optimize, and plan capacity for your integrations.
The following use cases show how to apply the pipeline lifecycle metrics to common
monitoring tasks. Each use case lists the primary tag filters to apply, describes the
dashboard panels shown in the example, and provides a representative PromQL query. PromQL is used here only as an example; because the
metrics are emitted through OpenTelemetry, you can build equivalent dashboards in any
compatible observability tool using that tool's query language. In PromQL, metric names use
underscores rather than dots — for example,
plexnode_pipeline_executeDuration_avg. Variables such as
$snaplex and $root_invoker_path are dashboard template
variables you bind to tag values.
Scheduled Task performance monitoring
Track execution duration for a periodic scheduled job and catch outliers or degradation
early. Filter on root_invoker_type="scheduled" and
root_invoker_path; add invoker_type="nested" to find the
slowest child pipeline. The dashboard shows average and P95 execution duration, the top
bottleneck nested pipelines, and a success-rate gauge.
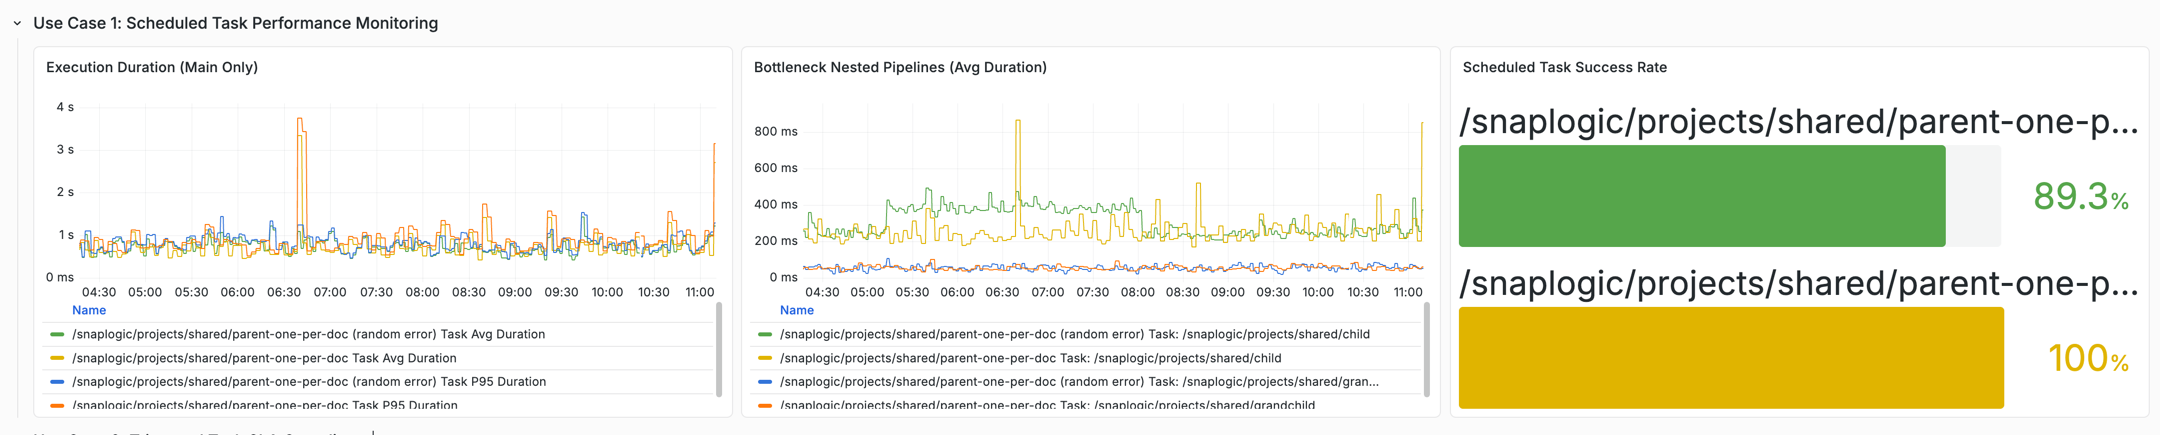
Average execution duration by Scheduled Task:
avg by (root_invoker_path) (
  plexnode_pipeline_executeDuration_avg{
    snaplex=~"$snaplex",
    root_invoker_path=~"$root_invoker_path",
    root_invoker_type="scheduled"
  }
)
Watch for spikes above the P95 baseline (outliers), upward trends over time (degradation), and a large gap between average and P95 (high variance). When the success rate drops below 100%, investigate the error panels described in Error analysis and remediation.
Triggered Task SLA compliance
Verify that customer-facing API integrations meet latency and availability targets. Filter
on root_invoker_type="trigger" and root_invoker_path. The
dashboard shows P99 latency (prepare plus execute), success rate per endpoint, throughput in
requests per second, and queue pressure.

P99 latency (prepare plus execute) for the five slowest endpoints:
topk(5,
  avg by (root_invoker_path) (
    plexnode_pipeline_prepareDuration_p99{
      snaplex=~"$snaplex", root_invoker_type="trigger",
      root_invoker_path=~"$root_invoker_path"
    }
  )
  +
  avg by (root_invoker_path) (
    plexnode_pipeline_executeDuration_p99{
      snaplex=~"$snaplex", root_invoker_type="trigger",
      root_invoker_path=~"$root_invoker_path"
    }
  )
)
Queue pressure is the difference between the execution start rate and the stop rate. A value that oscillates around zero (or holds a stable, non-increasing positive value) is healthy — the system is keeping pace with demand. Only a sustained upward trend indicates that the system cannot keep up and capacity should be scaled.
Nested pipeline chain analysis
Identify bottlenecks and understand document flow in a workflow with multiple nested
pipelines. Filter on root_invoker_path and
invoker_type="nested". The dashboard breaks down execution duration by
pipeline path and shows document flow by direction.

Execution duration breakdown by nested pipeline:
avg by (path, root_invoker_path, root_invoker_type) (
  plexnode_pipeline_executeDuration_avg{
    snaplex=~"$snaplex",
    root_invoker_path=~"$root_invoker_path",
    invoker_type="nested"
  }
)
The pipeline with the highest or most variable duration is your optimization target. When comparing document flow, an input rate that roughly matches the output rate indicates healthy processing; input greatly exceeding output may indicate filtering, aggregation, or data loss.
Snaplex capacity planning
Ensure Snaplex clusters have adequate capacity for current and projected load. Filter on
snaplex. The dashboard shows active pipelines by Snaplex, queue pressure
by Snaplex, and average duration correlated with load.

Active pipelines by Snaplex:
sum by (snaplex) (
  plexnode_pipeline_active_value{
    snaplex=~"$snaplex"
  }
)
Compare active pipeline counts against your known Snaplex capacity limits to plan scaling. If average duration increases as the active count rises, the nodes are experiencing resource contention — add nodes or optimize the heaviest pipelines.
Error analysis and remediation
Categorize, prioritize, and resolve pipeline failures. Filter on snaplex,
root_invoker_path, and the error tag. The dashboard
shows the error-rate trend, the top errors by type, and the pipelines with the highest error
rate.

Top 10 errors by type:
topk(10,
  sum by (error) (
    increase(plexnode_pipeline_errors_total{
      snaplex=~"$snaplex",
      root_invoker_path=~"$root_invoker_path"
    }[$__range])
  )
)
Address the dominant error type first. When a single error type accounts for most failures, use the highest-error-rate panel to find the culprit pipeline and fix the root cause (for example, a missing script, configuration error, or permission issue). When errors are spread across many types, check whether they correlate with a deployment, a time window, or a specific Snaplex.
Ultra Task monitoring
Ensure always-on Ultra Tasks
remain healthy over extended periods. Filter on invoker_type="ultra" and
path. The dashboard shows active Ultra Tasks, throughput, restart rate,
error rate, and top errors.
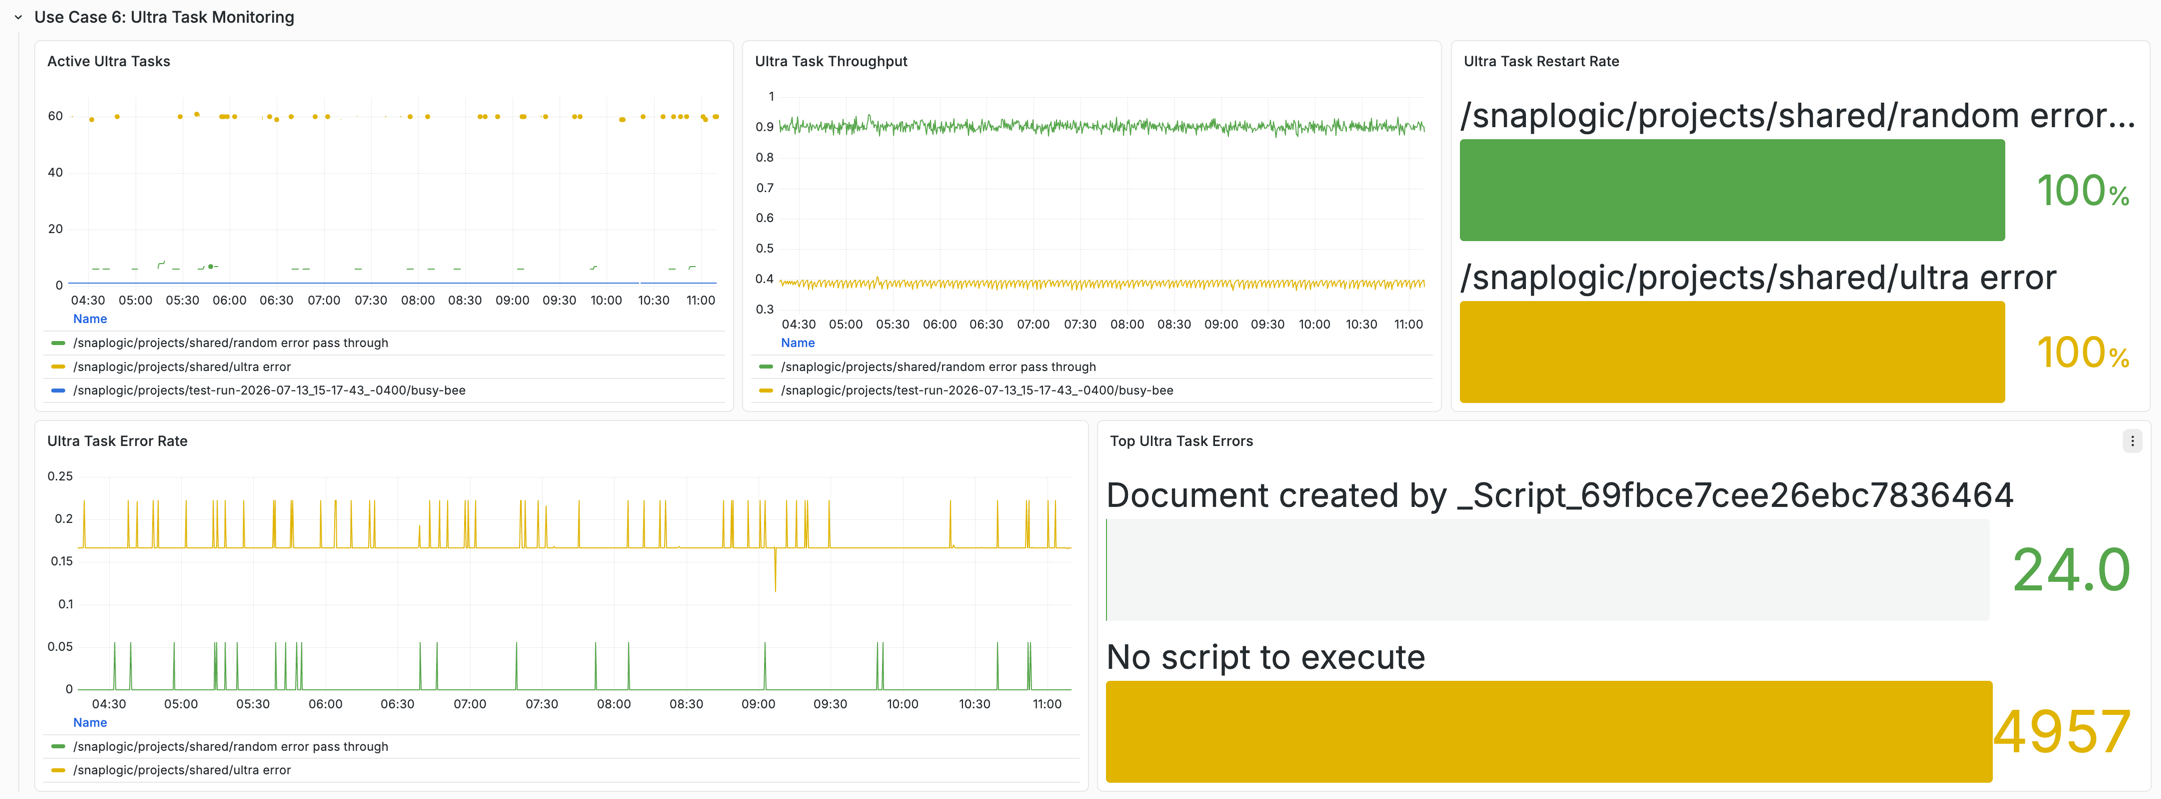
Ultra Task throughput (output documents per second):
sum by (path) (
  plexnode_pipeline_documents_processed_oneMinRate{
    snaplex=~"$snaplex", path=~"$path",
    invoker_type="ultra", direction="out"
  }
)
Stable throughput indicates a healthy task; throughput dropping to zero indicates a stall that needs investigation. Gaps in the active-task chart can mean restarts, intentional stops, or failures. A rising error rate signals degrading health — check the top Ultra Task errors and fix them at the source.
Dimension selection guide
Use this guide to choose the primary filter and metrics for a given goal.
| Goal | Primary filter | Key metrics |
|---|---|---|
| Monitor a scheduled job | root_invoker_type="scheduled",
root_invoker_path |
plexnode.pipeline.executeDuration,
plexnode.pipeline.execution.stop.total by
outcome |
| Track API endpoint SLAs | root_invoker_type="trigger",
root_invoker_path |
plexnode.pipeline.prepareDuration +
plexnode.pipeline.executeDuration,
plexnode.pipeline.execution.stop.total |
| Debug a slow workflow | root_invoker_path, invoker_type="nested" |
plexnode.pipeline.executeDuration by
path |
| Plan Snaplex capacity | snaplex |
plexnode.pipeline.active.value,
plexnode.pipeline.execution.start.total,
plexnode.pipeline.execution.stop.total |
| Analyze errors | snaplex, root_invoker_path |
plexnode.pipeline.errors.total by error and
path |
| Monitor Ultra Tasks | invoker_type="ultra", path |
plexnode.pipeline.active.value,
plexnode.pipeline.documents.processed.oneMinRate,
plexnode.pipeline.errors.total |
Frequently asked questions
- Can I monitor pipeline executions in my own observability tool?
Yes. If your organization uses Third-party Observability, SnapLogic emits pipeline lifecycle metrics (
plexnode.pipeline.*) through OpenTelemetry to your configured backend, reporting execution state, phase durations, document throughput, and active pipeline counts. - How do I see how many pipelines are running concurrently on a
Snaplex?
Use the
plexnode.pipeline.active.valuegauge. You can filter it by pipeline path, task type (invoker_type), and Snaplex. See Snaplex capacity planning. - Can I filter pipeline metrics by task type (scheduled, trigger,
ultra)?
Yes. Pipeline lifecycle metrics carry
invoker_typeandroot_invoker_typetags whose values includescheduled,trigger, andultra. - Why don't the metrics show failures such as a misfire or a missing
account?
Pipeline lifecycle metrics capture only the execution phase, after a pipeline starts. Pre-start failures are reported by task-level metrics (
plexnode.state.tasks.loading.*andplexnode.state.task.scheduled.*). See What these metrics capture.