


Infrastructure Snaplexes view
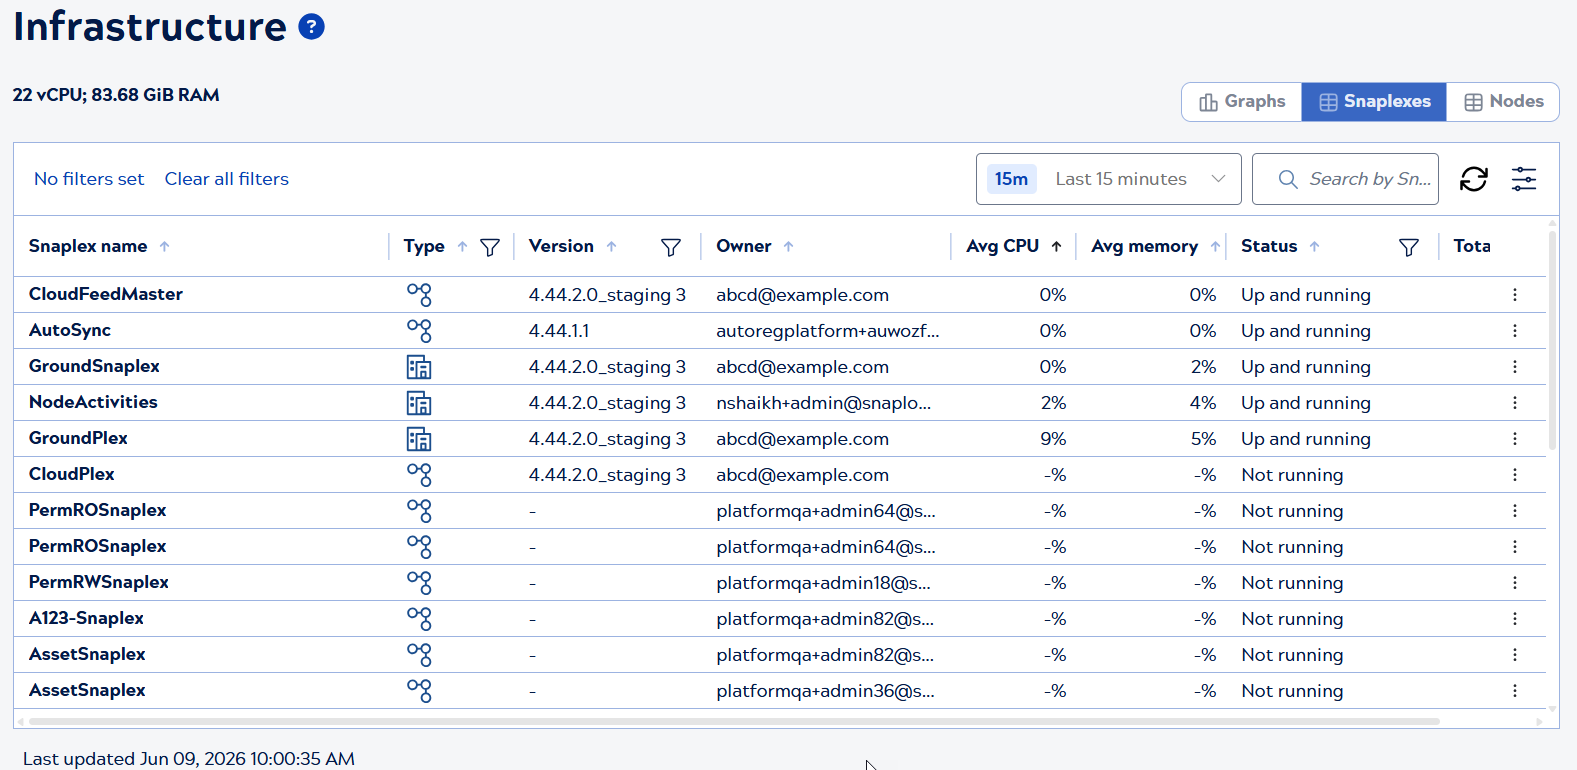
The Infrastructure Snaplexes view displays a table of all Snaplexes in your environment with aggregate statistics. The total number of virtual CPUs and total memory allocated across all Snaplex nodes display under the page title.
View selector
Use the view selector on the right side of the page to switch between Infrastructure views:
- Graphs: Visual display of resource usage
- Snaplexes: Table view of Snaplex-level information (current view)
- Nodes: Table view of individual node details
Note: When switching between views, applicable filters such as the time period are retained. Filters specific to one view are not carried over.
Page controls
Use the controls above the table to:
- Select a time period from the dropdown menu (Last 15 minutes through Last 45 days)
- Search for Snaplexes by name using the search box
- Refresh table data
- Configure filters using the filter icon
Table information
The Snaplexes table displays the following columns:
- Snaplex name: Name of the Snaplex
- Type: Snaplex type with icon (Cloudplex or Groundplex)
- Version: Snaplex version number
- Owner: Snaplex owner email
- Avg CPU: Average CPU utilization across all nodes
- Avg memory: Average memory utilization across all nodes
- Status: Snaplex status (Up and running, Not running)
- Three-dot menu: Additional actions for the Snaplex
Click a Snaplex row to open the Snaplex details panel.