Analyze a failed pipeline execution

Use the SnapGPT Assistant to analyze a failed pipeline execution and receive an AI-generated root cause analysis with suggested fixes.

SnapGPT must be enabled for your environment. Contact your Customer Success Manager (CSM) if SnapGPT is not available.

The Analyze failed pipeline execution skill is available on the Pipeline executions page in Monitor when you open the detail panel of a failed execution. The SnapGPT Assistant examines the error message and stack trace of the failed Snap and provides a root cause analysis along with a prioritized list of suggested fixes. The recommended fix is shown first. Each fix includes a description, an optional code diff, and an Open in Designer button so you can act on the suggestion without losing the analysis.

  1. In Monitor, click Pipeline executions in the left navigation pane under Analyze.
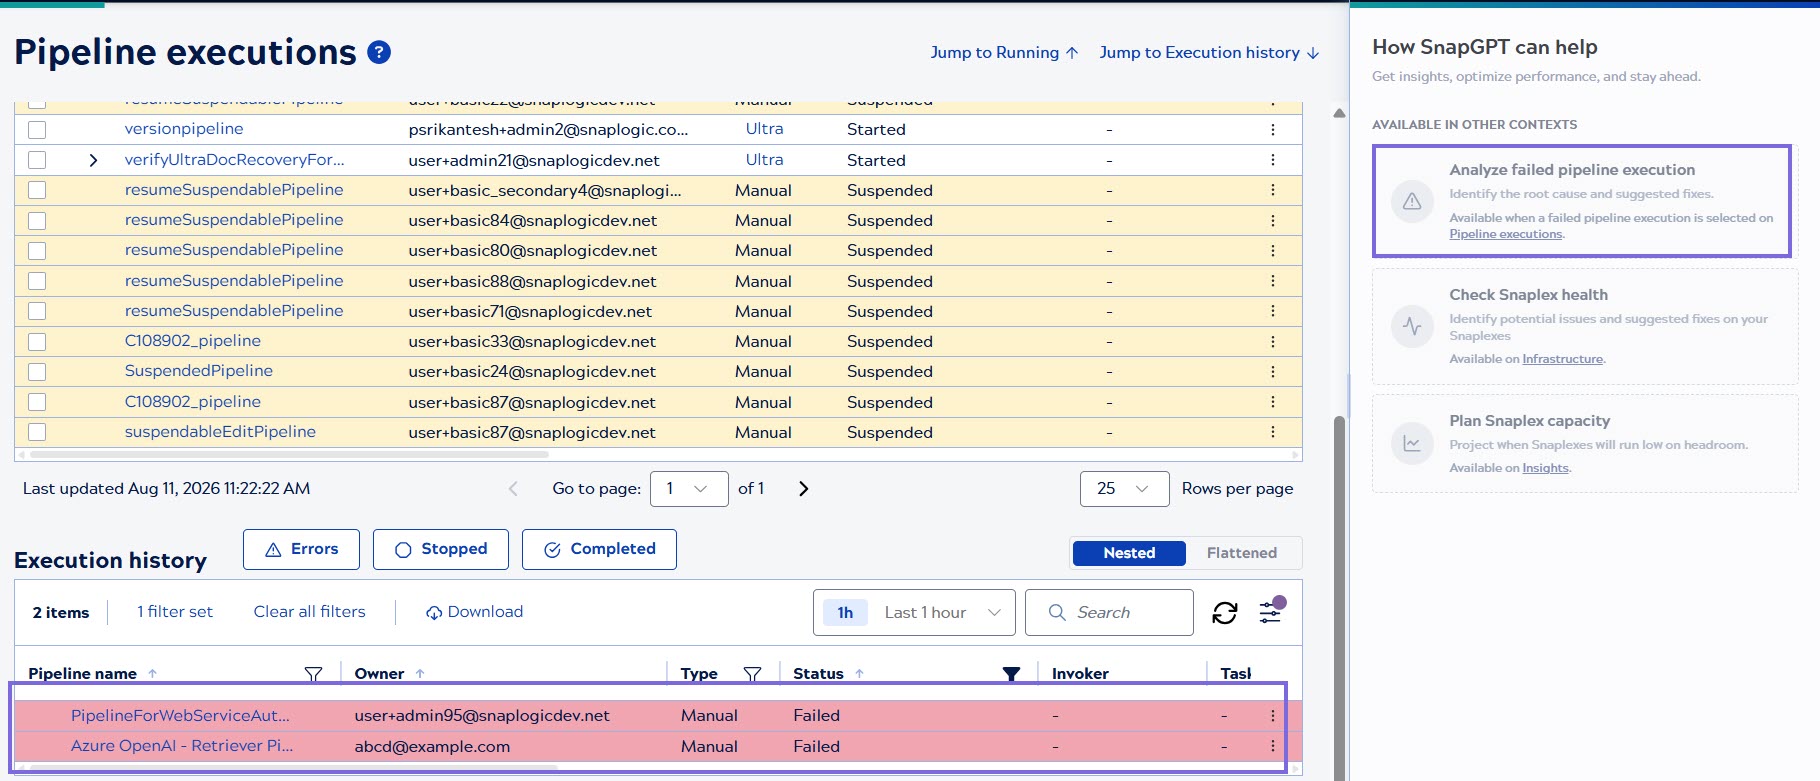
  2. In the Execution history table, locate the failed pipeline execution and click its row to open the execution detail panel.

    Failed executions are highlighted in red in the table. Use the Errors filter button above the table to show only failed executions. You can also filter by time range using the time selector, or search by pipeline name.

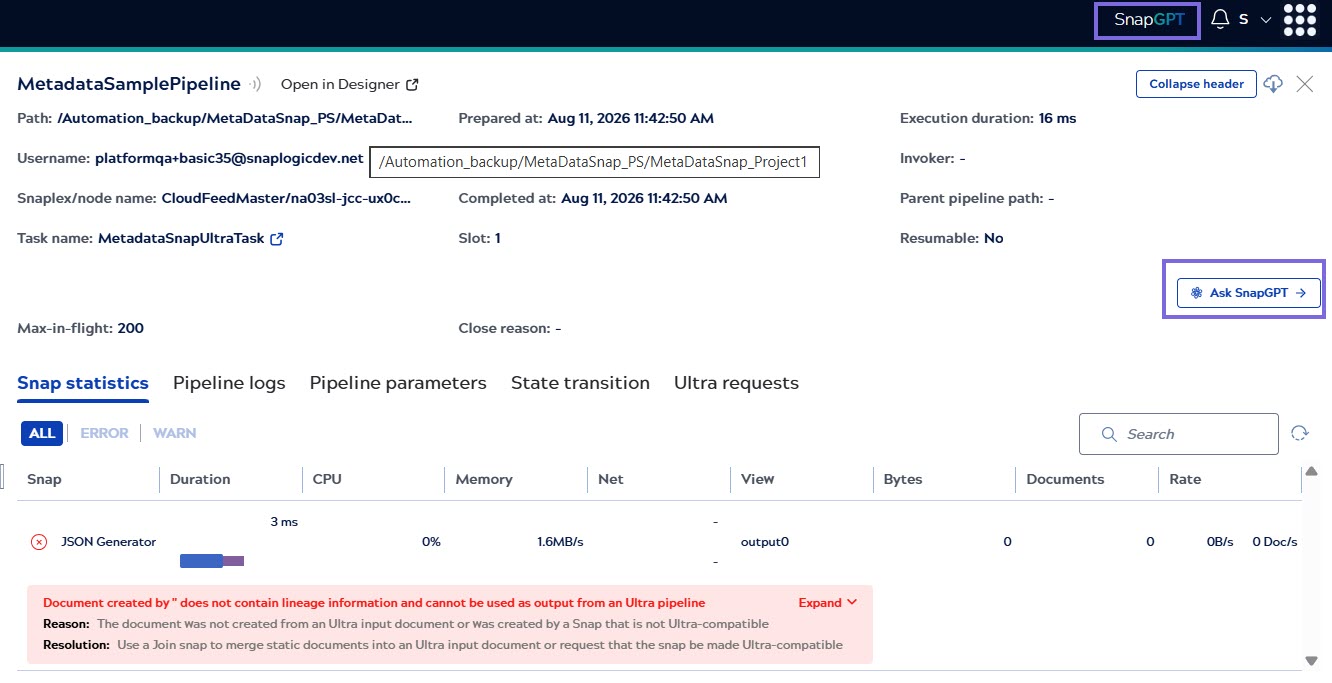
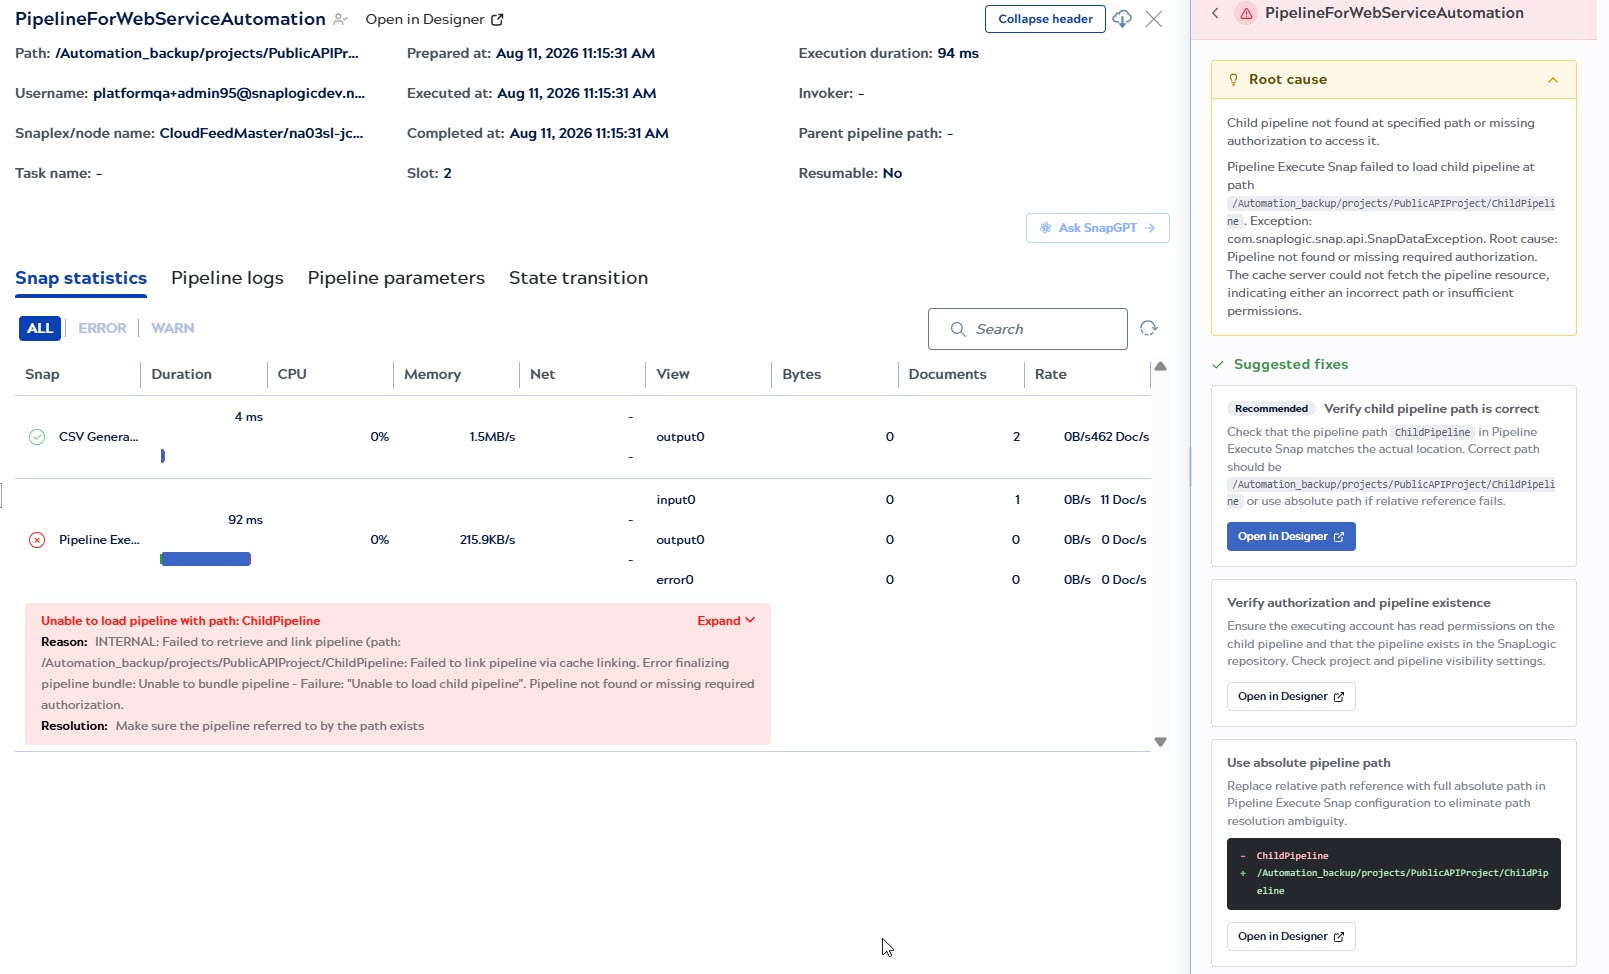
    The detail panel shows execution metadata including the pipeline path, Snaplex node name, execution duration, and the error message with resolution hint. The Snap statistics tab is selected by default, showing per-Snap duration, CPU, memory, and document counts.

  3. Open the SnapGPT Assistant panel using either of these methods:
    • Click Ask SnapGPT in the execution detail panel.
    • Click the SnapGPT button in the Monitor header.

    If this is the first time you are opening the SnapGPT Assistant in Monitor, the Welcome to SnapGPT for Observability! screen appears. Review the guidelines and click Understood, Let's Begin to continue.

    The panel then displays the How SnapGPT can help home screen. Analyze failed pipeline execution appears under Actions available now.

  4. Click Analyze failed pipeline execution.
    The panel begins analyzing the failed execution. A loading indicator is displayed while the analysis is in progress.
  5. Review the analysis result in the SnapGPT Assistant panel.

    The panel header shows a warning icon and the name of the pipeline being analyzed. The result contains two sections:

    • Root cause: A concise headline describing the probable cause of the failure, followed by a detailed explanation. Technical terms, class names, and code fragments are formatted inline for readability. Click the section header to collapse or expand it.
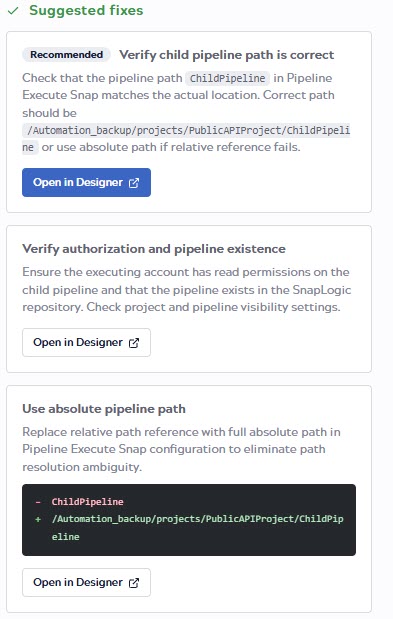
    • Suggested fixes: A prioritized list of recommended actions to resolve the issue. Each fix card shows:
      • A Recommended badge on the primary fix.
      • A title and description of the fix.
      • Where applicable, a code diff showing the change to make, with lines to remove and lines to add clearly marked.
      • An Open in Designer button. The button on the recommended fix is filled; the buttons on other fixes are outlined.

    A disclaimer at the bottom of the panel reads: AI may make mistakes. Verify suggested fixes before applying.

  6. Optional: To investigate further in Designer, click Open in Designer on a fix card.

    Designer opens in a new browser tab and displays the Pipeline Execution Statistics dialog for the failed execution. The dialog shows the failing Snap with a red error indicator, the top-level error message, and the reason for the failure. Use the Snap Statistics, Pipeline Parameters, and Extra Details tabs to inspect the execution in detail. Close the dialog to access the pipeline canvas.

    The SnapGPT Assistant panel remains open on the Monitor page with the analysis visible, so you can refer to the suggested fix while working in Designer.

The SnapGPT Assistant provides a root cause analysis and a prioritized list of suggested fixes for the failed execution, reducing the time needed to locate the cause of the failure and take corrective action.

After applying a fix in Designer, run the pipeline again from Monitor or Designer to confirm that the issue is resolved. If the pipeline does not run successfully, open the new failed execution in Monitor and run a fresh analysis to check whether a different root cause is identified.