


MCP metrics
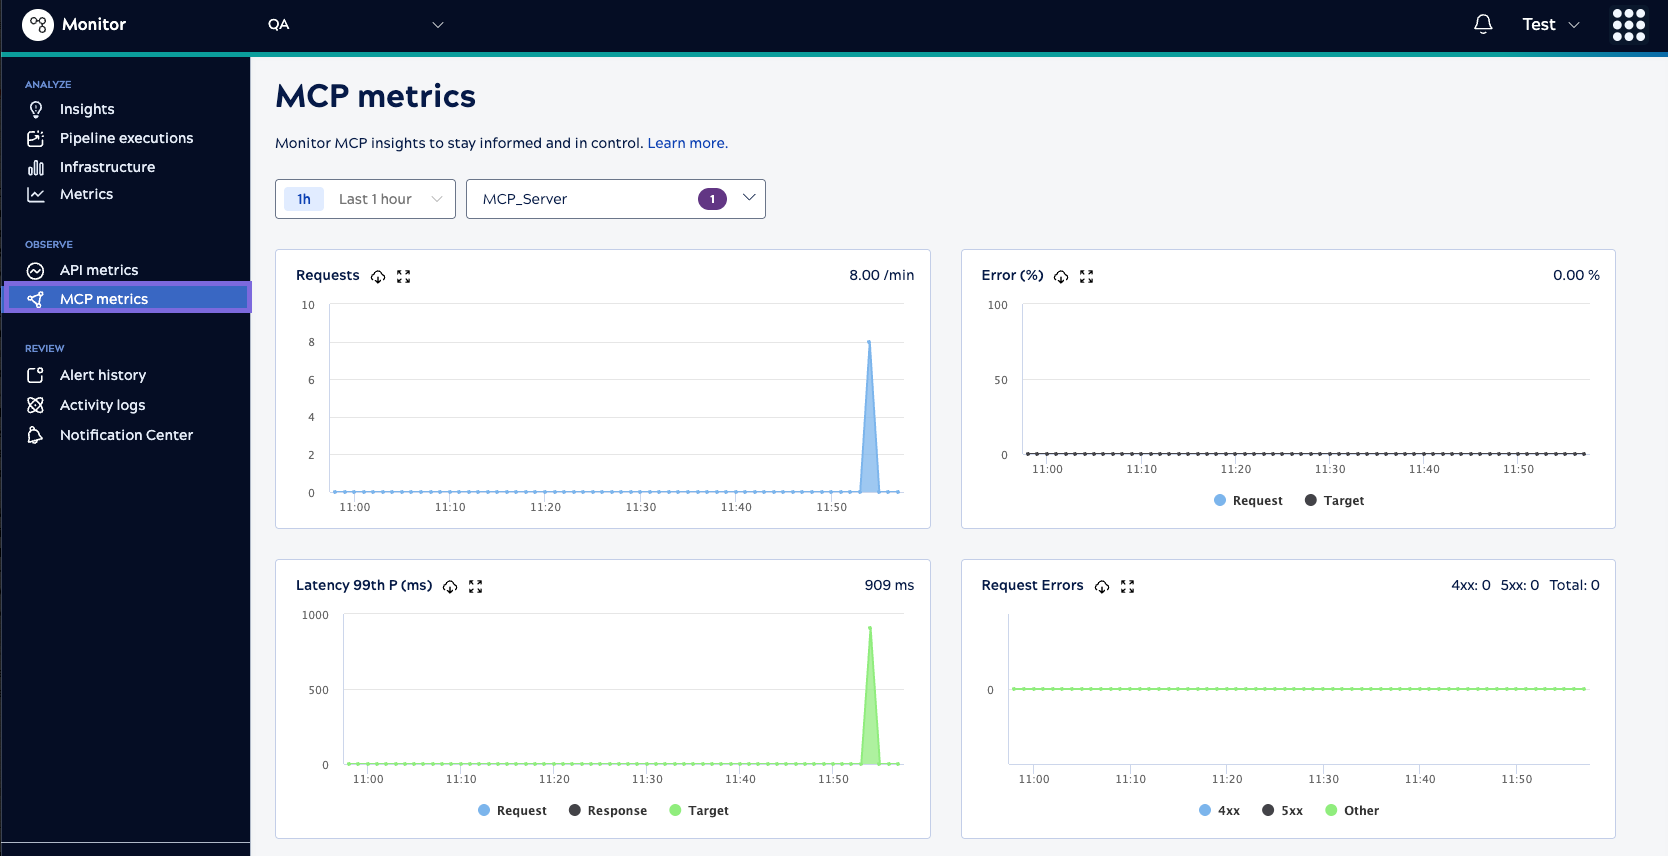
The MCP metrics page reports usage, latency, and errors for MCP Servers. A set of graphs show the aggregated metrics and the MCP Details table breaks down the data per request.
Non-admin users can view data on assets for which they have at least read permission. Environment admins can view details about all assets in the environment (Org).
Snaplex nodes aggregate the MCP data every minute and it reflects on MCP metrics page one or two minutes later. Metrics include data for up to the last seven days. You can select a custom time period that includes statistics for a three day window in the last seven days.
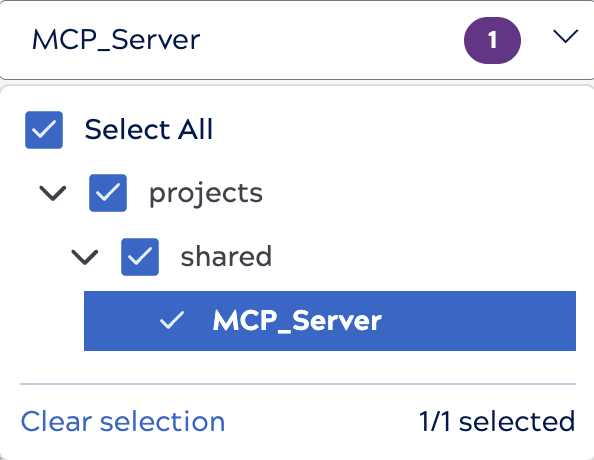
When the table contains many MCP Servers, the filter control includes a search box where you can search by Project or MCP Server:
To accumulate data over longer periods of time, download metrics periodically. A download includes data from the selected time period. Usage data can help you choose a combination of policies to protect the MCP Servers. Latency metrics can help you fine-tune MCP Server traffic control policies, such as throttling, request size limits, retries, and caching.
Graphs
The MCP metrics page includes the following graphs:
- Requests: The number of requests during the selected time period. The graph
displays requests per minute on the top right of the chart, calculated as the rate at which the
system is processing requests.
- For a 1-hour time period, the chart displays the aggregated number of requests processed each minute.
- For 8-hour and longer time periods, the chart displays 15-minute data points as the indication of the throughput of the MCP ecosystem.
- Request Errors: The 400 and 500 errors that result in a canceled request, typically because of an MCP policy violation or failed authentication. Pipeline preparation and execution don't occur.
- Error Percentage: The errors that occur as a percentage of the total number of requests. This metric indicates misconfigured MCP Server or tool.
- 99 Percentile Latency: The number of milliseconds that the MCP
ecosystem takes to respond to a call. The 99p latency value means that 99 out of 100 API
data samples fall below this value. This metric indicates the efficiency or the cycle
time of the MCP ecosystem.
- Request Latency: The time to link the task definition, run MCP policies, and authenticate the request in milliseconds (ms).
- Target Latency: The time to prepare and execute the pipeline to completion in milliseconds (ms).
- Response Latency: The time to collect statistics and process the response to the caller in milliseconds (ms).
MCP Details table
The MCP Details table presents metrics per MCP Server for comparative analysis. The order of the MCP Servers defaults to requests per minute with the most requested MCPs at the top. You can also sort by error percentage and latency to identify problems with MCP Server/tool execution.
The elapsed time breakdown by request, wait, and target enables you to troubleshoot where
the issue occurred for failed requests. For example, a delay between the request and wait
times could indicate a policy configuration issue. 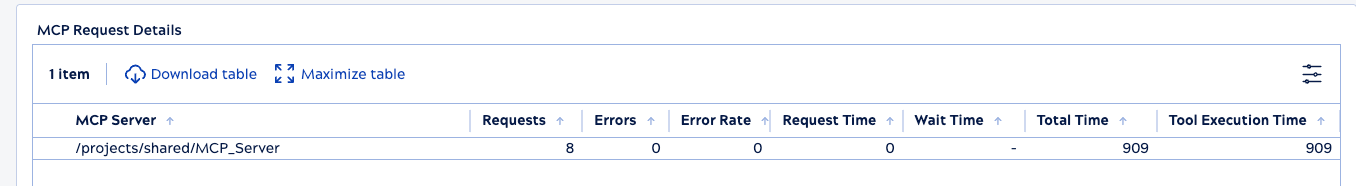
The table supports the following operations:
- To sort the list, click the column header.
- To download a CSV summary of the information, click the download icon (
 ).
). - To display executions for a specific MCP, click the name.
- To switch between compact and normal row spacing, nesting of child executions, or show or hide
columns, click
 to open the Table configuration and filters dialog.
MCP request details
MCP Server request details provide additional information about MCP request executions.
To view request details, click an execution. Click Back to return
to the MCP Details table.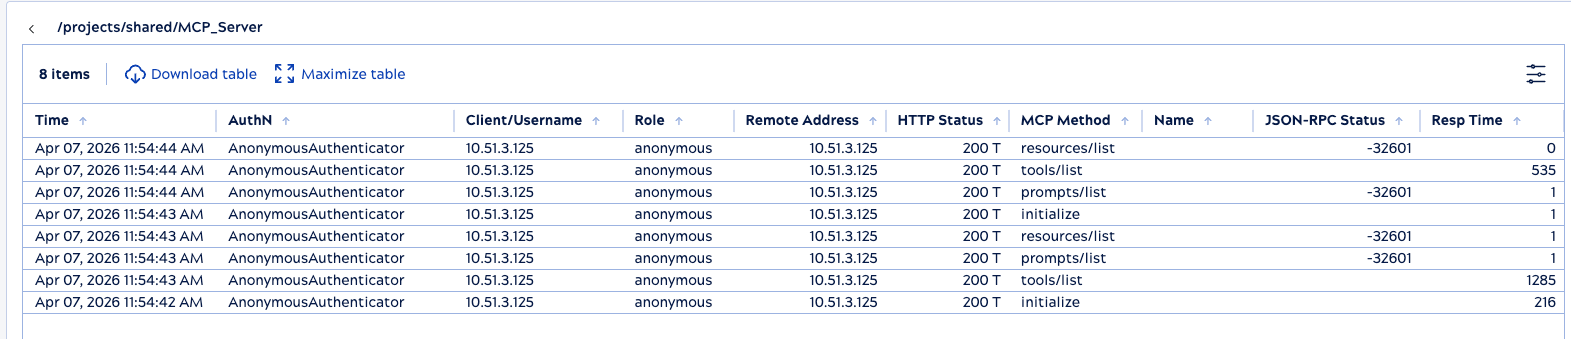
| Column | Description |
|---|---|
| Time | When the MCP Server was invoked. |
| AuthN | The authentication type used for the request, if applicable. |
| Client/Username | The client identifier (IP address of the requester) or the username (ID used for authentication). |
| Role | User role, if applicable. |
| Remote Address | The client IP of the tool caller. |
| HTTP Status | The HTTP status code of the request. |
| MCP method | The request type made to the MCP Server. |
| Name | The name of the tool, if the request is an MCP tools/call request. |
| JSON-RPC Status | The JSON-RPC error code the request returns. |
| Resp Time (ms) | The number of milliseconds from the time the request is received to the time the response is sent. |