


Launch data preview
execute permissions to the pipeline Project/Project Space.You can launch the data preview window from the pipeline canvas in Designer.
-
In Designer, click
 to validate the pipeline.
-
After the validation is complete, click the
 in the connector on the right side of the
Snap:
in the connector on the right side of the
Snap:
 Tip: If the data preview does not display or you get a validation error, go to App Settings from your user profile and select fewer records to preview, within the maximum your Environment admin has configured. Data preview is also capped at 15 MB total regardless of record count. If changing the number of records does not work, check with your administrator to see if Pipeline Validation has been disabled at the Org level.Tip: If the preview data is not exactly what you are expecting, the browser might be caching stale data. In the toolbar, click Retry:
To navigate the data preview of a validated pipeline, refer to Navigate data previews.
Default view
By default, the data preview displays as a table. The data preview for some Snaps, such as file readers, displays the metadata instead of data values. The following example shows preview data values after passing through an Excel Parser Snap:
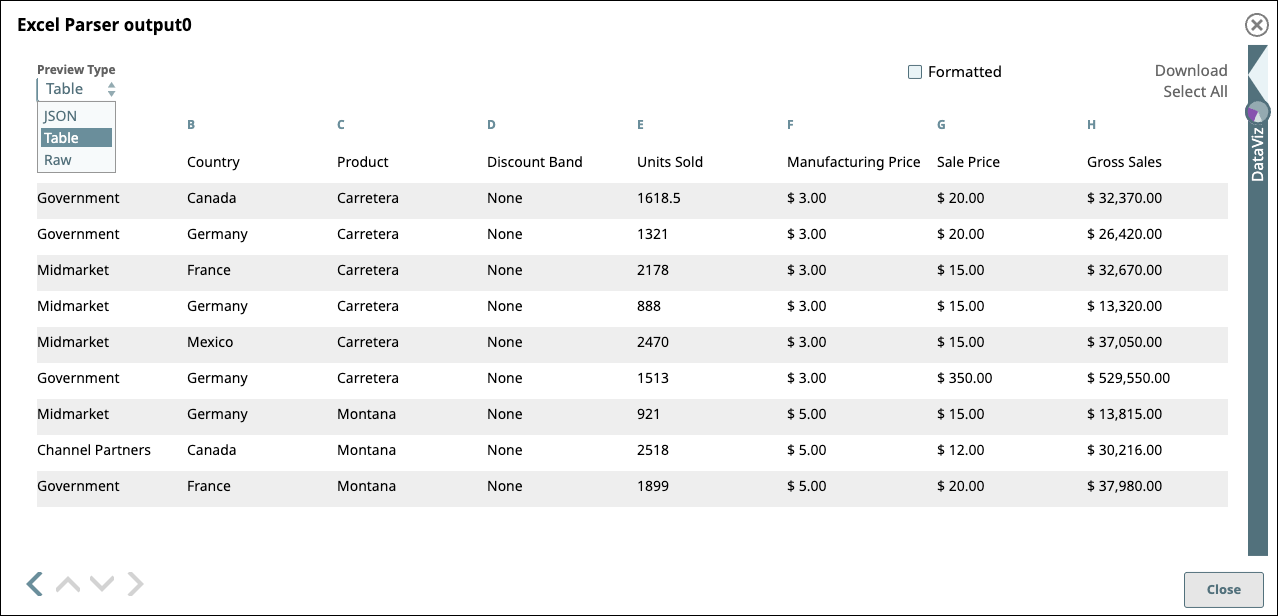
Data preview displays by default in a standard table with infinite scrolling capabilities.
Summary of controls
Use the controls in the data preview pane to switch formats, navigate records, and generate charts. For a description of all controls, refer to Data preview controls.