


Snap Usage Report
Lists every Snap Pack in your environment along with its type and the number of pipelines that use each Snap.
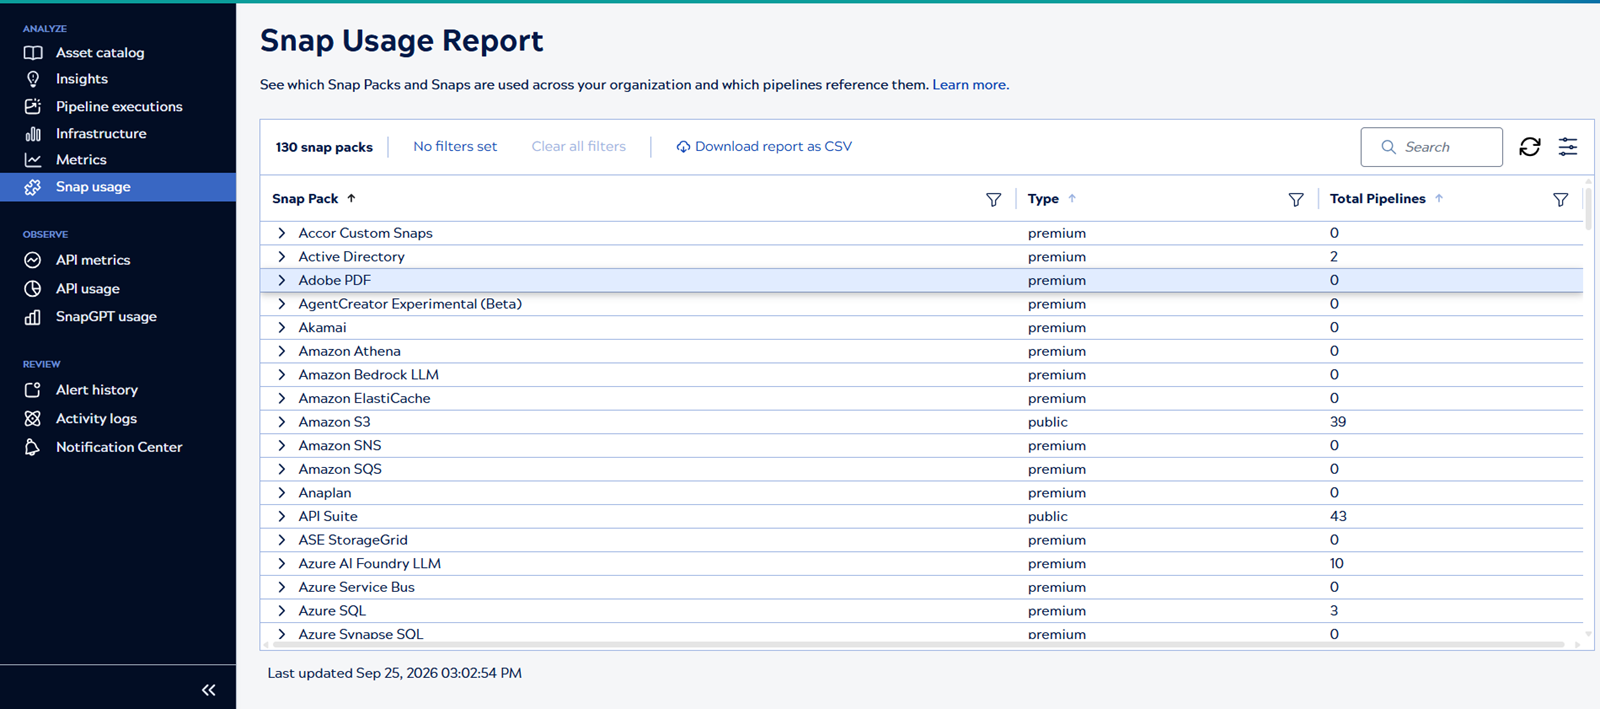
- Self-service & role access: Accessible to all users without special role restrictions.
- On-demand generation: Generate the latest statistics on demand using the Generate button, with caching support so reports persist when navigating between views.
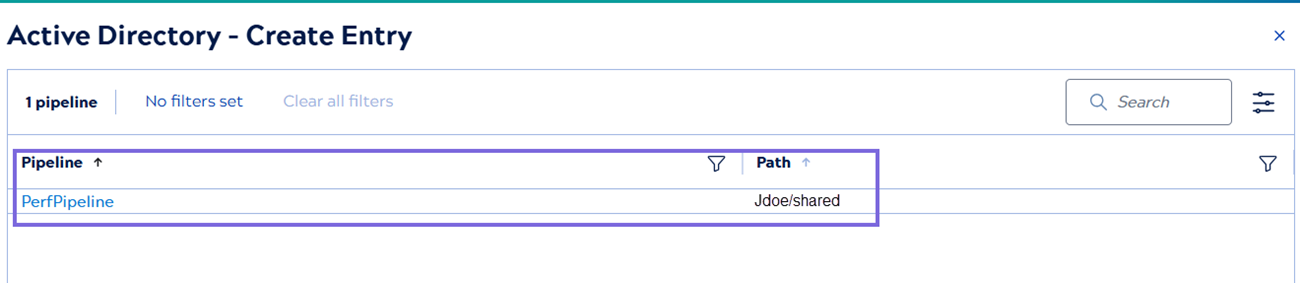
- Pipeline drill-down panel: Clicking on a specific Snap opens a side panel displaying all pipelines referencing that Snap, complete with direct links to open them in Designer.
- CSV Export: Download the full report as a CSV file matching the legacy format (snap_stats_report-*.csv) for offline analysis and auditing.
With large number of Snaps and pipelines, this action may take some time as the index creation happens in an offline manner, with a delay of few minutes. Therefore, the report might be delayed with a few minutes delay in showing new entries. If you create a pipeline, wait for a few minutes and then generate the Snap usage report, the new pipeline will be shown in the report.
Snap usage table
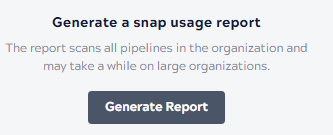
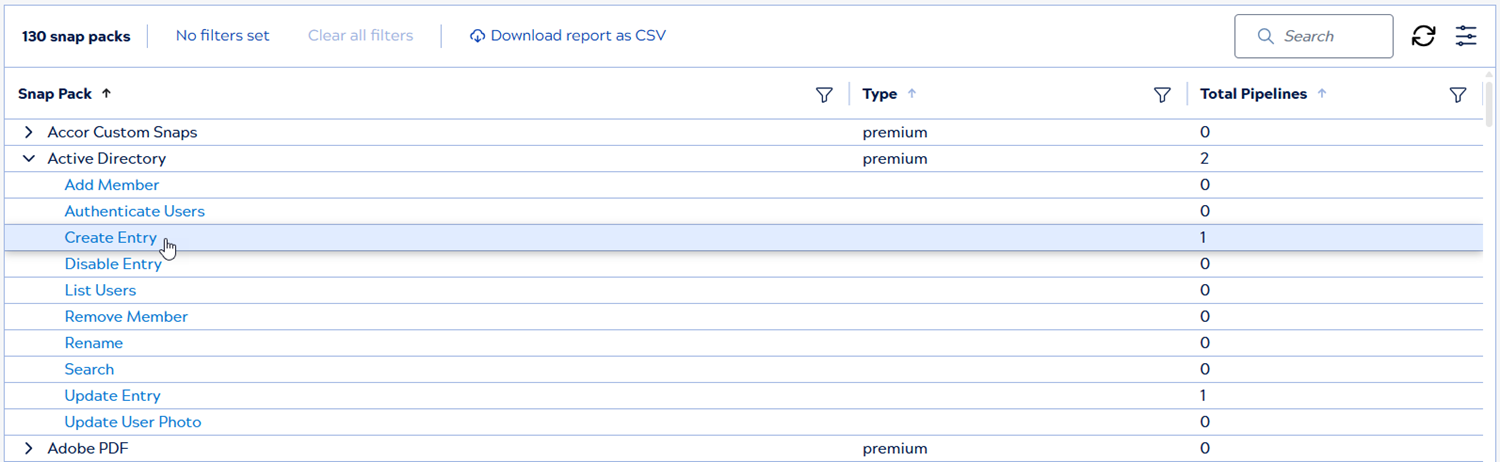
The Snap usage report table displays the following columns:
| Column | Description |
|---|---|
| Snap Pack | The name of the Snap Pack. Click the chevron next to a Snap Pack to expand the row and see the individual Snaps in that Snap Pack. |
| Type | The license type of the Snap Pack, either public or premium. Public Snaps are common to all users. Premium Snaps are purchased separately. |
| Total Pipelines | The number of pipelines in the current environment that use the Snap Pack or the individual Snap. |
Table controls
-
Click the arrow
 on the column header to sort
the column.
on the column header to sort
the column. -
Click the filter
 icon in the header to filter
the column.
icon in the header to filter
the column. -
No filters set / Clear all filters indicates whether column filters are applied. Click Clear all filters to remove them.
- Refresh
 icon
reloads the report with the latest data.
icon
reloads the report with the latest data. - Configurable table view
 icon enables you to configure
the table columns. Learn
more.
icon enables you to configure
the table columns. Learn
more. - Click the Download report as CSV link to download the current view of the report as a .csv file. This report contains the pipeline usage statistics, such as Snap name, pipeline name, link, and project for each individual Snap. To use the pipeline link information, add it to https://elastic.snaplogic.com. You will need to be logged in and have permission to that pipeline's project to access it.
Table configuration and filters
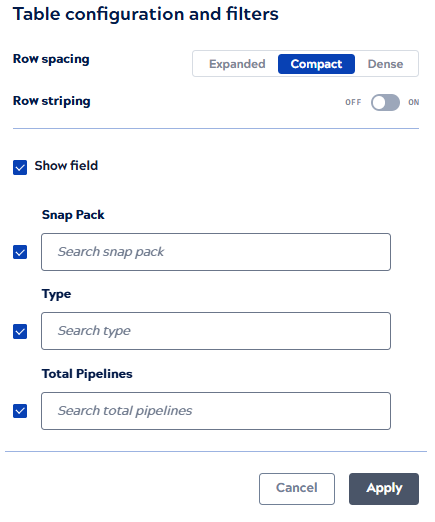
Row spacing: Choose how tightly rows are packed:
- Expanded: Adds whitespace between rows; easiest to scan a single row at a time.
- Compact: Default balance; less vertical space per row so more rows fit on screen.
- Dense: Minimum row height; maximizes rows visible without scrolling.
Row striping: Toggle alternating row background color:
- On: Every other row uses a shaded background to help the eye track across wide rows.
- Off: All rows use the same background.
Show field: Master checkbox that displays all the columns—it is selected by default. Each column can be shown (selected) or hidden (deselected) and, when selected, is filterable through the search box under it.
Click Apply to save changes. The report re-renders with the new spacing, striping, visible columns, and filters.