


Compute statistics for data analysis
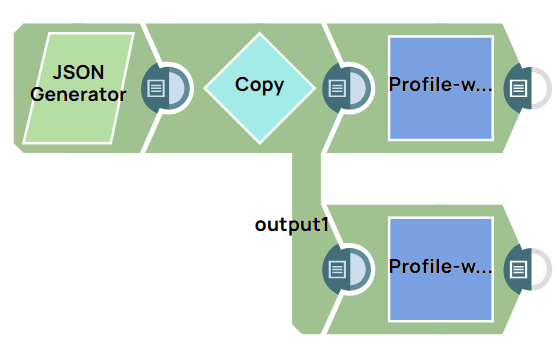
This example pipeline demonstrates how to compute data statistics with and without Value distribution enabled.
-
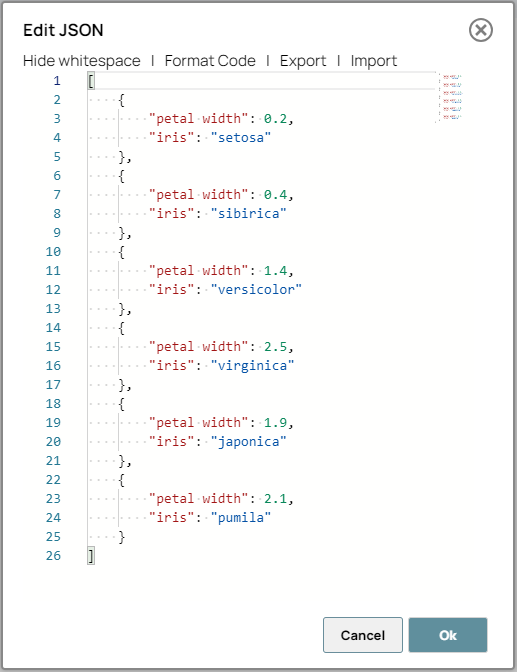
Configure the JSON
Generator Snap to pass your input data.
Note: In this example, we use the JSON Generator Snap. However, you can replace the JSON Generator Snap with any Snap of your choice, such as the Chunker, Constant, File Reader , or S3 File Reader Snaps.
-
Configure the Profile Snap to compute data statistics with Value distribution enabled, providing comprehensive insights into your data set's characteristics.
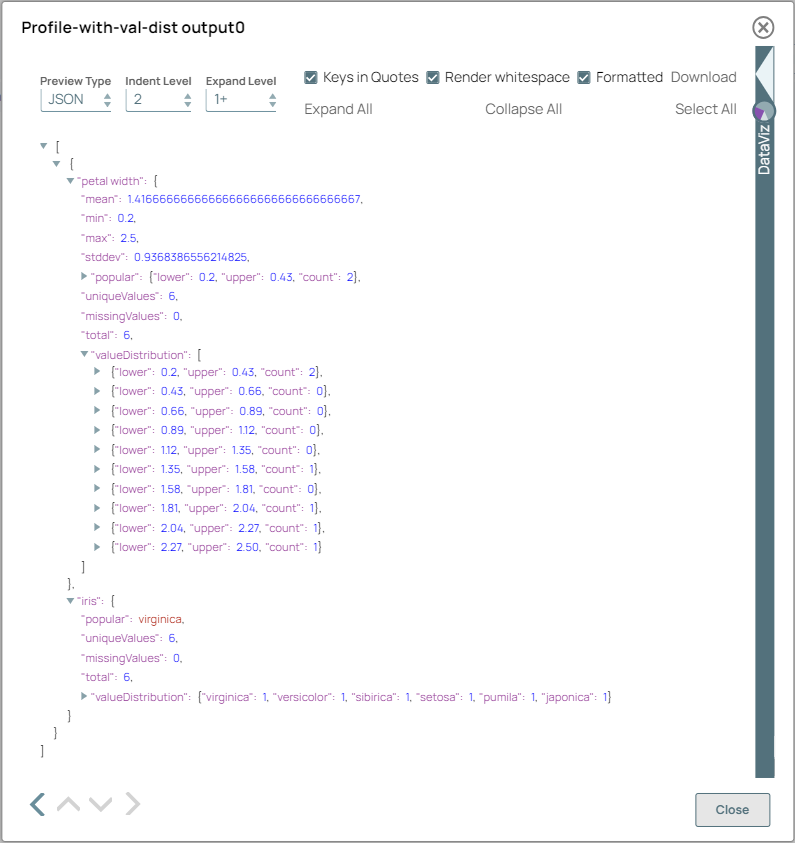
On validation, the Snap displays a summary of the computed data statistics, including measures such as mean, median, mode, standard deviation, and more.
Profile Snap (with Value distribution) configuration Profile Snap (with Value distribution) output 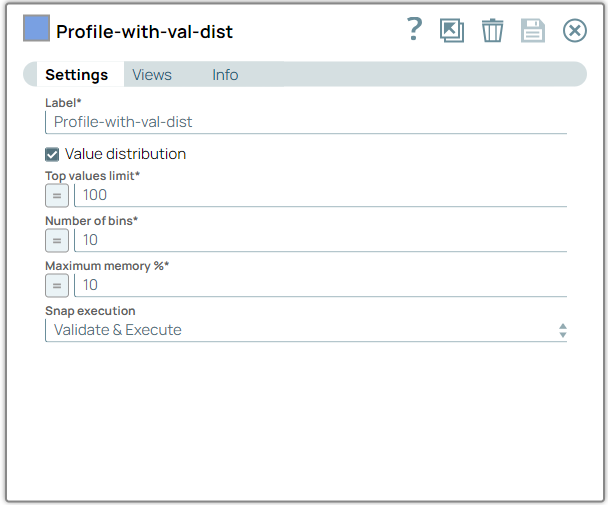
-
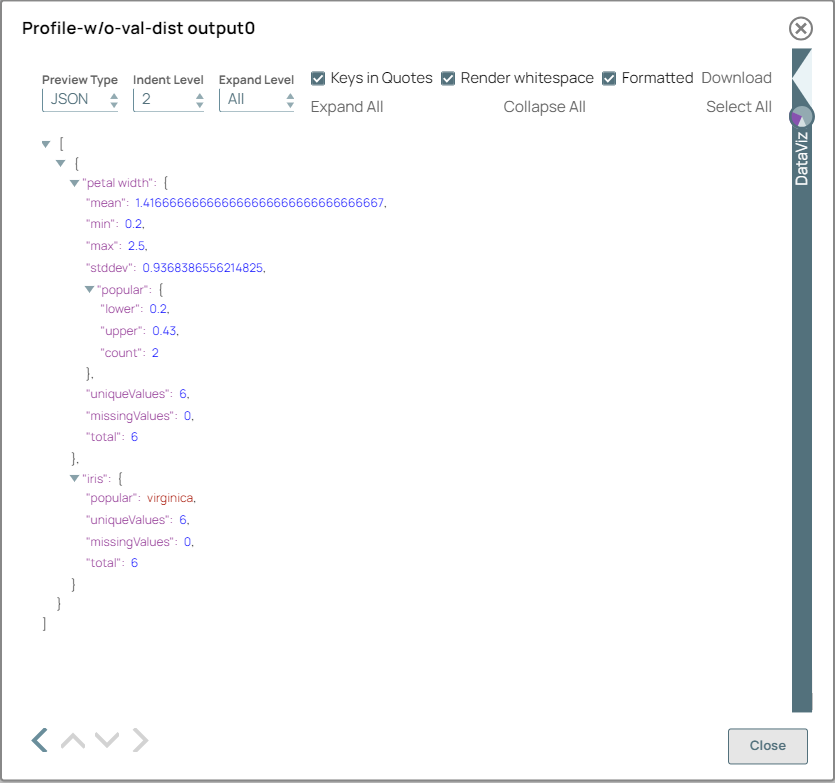
Configure the Profile Snap to compute data statistics with Value distribution disabled, providing a basic summary of key statistical measures such as mean, median, mode, standard deviation, and others.
On validation, the Snap displays a summary of the computed data statistics, including measures such as mean, median, mode, standard deviation, and more.
Profile Snap (without Value distribution) configuration Profile Snap (without Value distribution) output 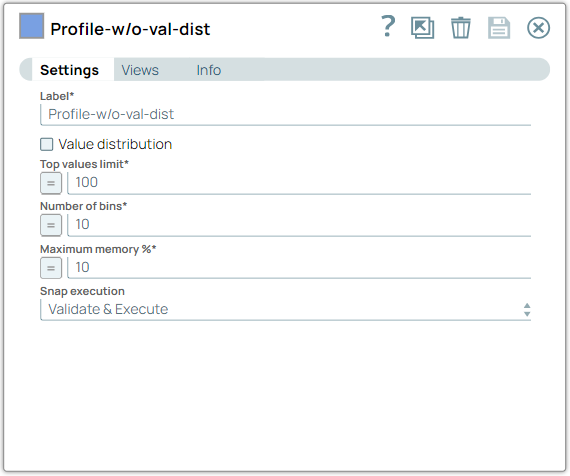
Note: After the data is generated, you can use Snaps such as the Filter and Aggregate Snaps for advanced processing. You can also use AgentCreator to integrate machine learning models.
- Download and import the pipeline into the SnapLogic Platform.
- Configure Snap accounts, as applicable.
- Provide pipeline parameters, as applicable.