Alert history
The Alert history page displays the alerts generated by Snaplex nodes for the specified time range. View alerts and the accompanying logs to identify and address Snaplex issues such as congestion. For example, the following shows alerts for tasks that are taking longer than expected and for node crashes. The shaded rows indicate closed alerts:
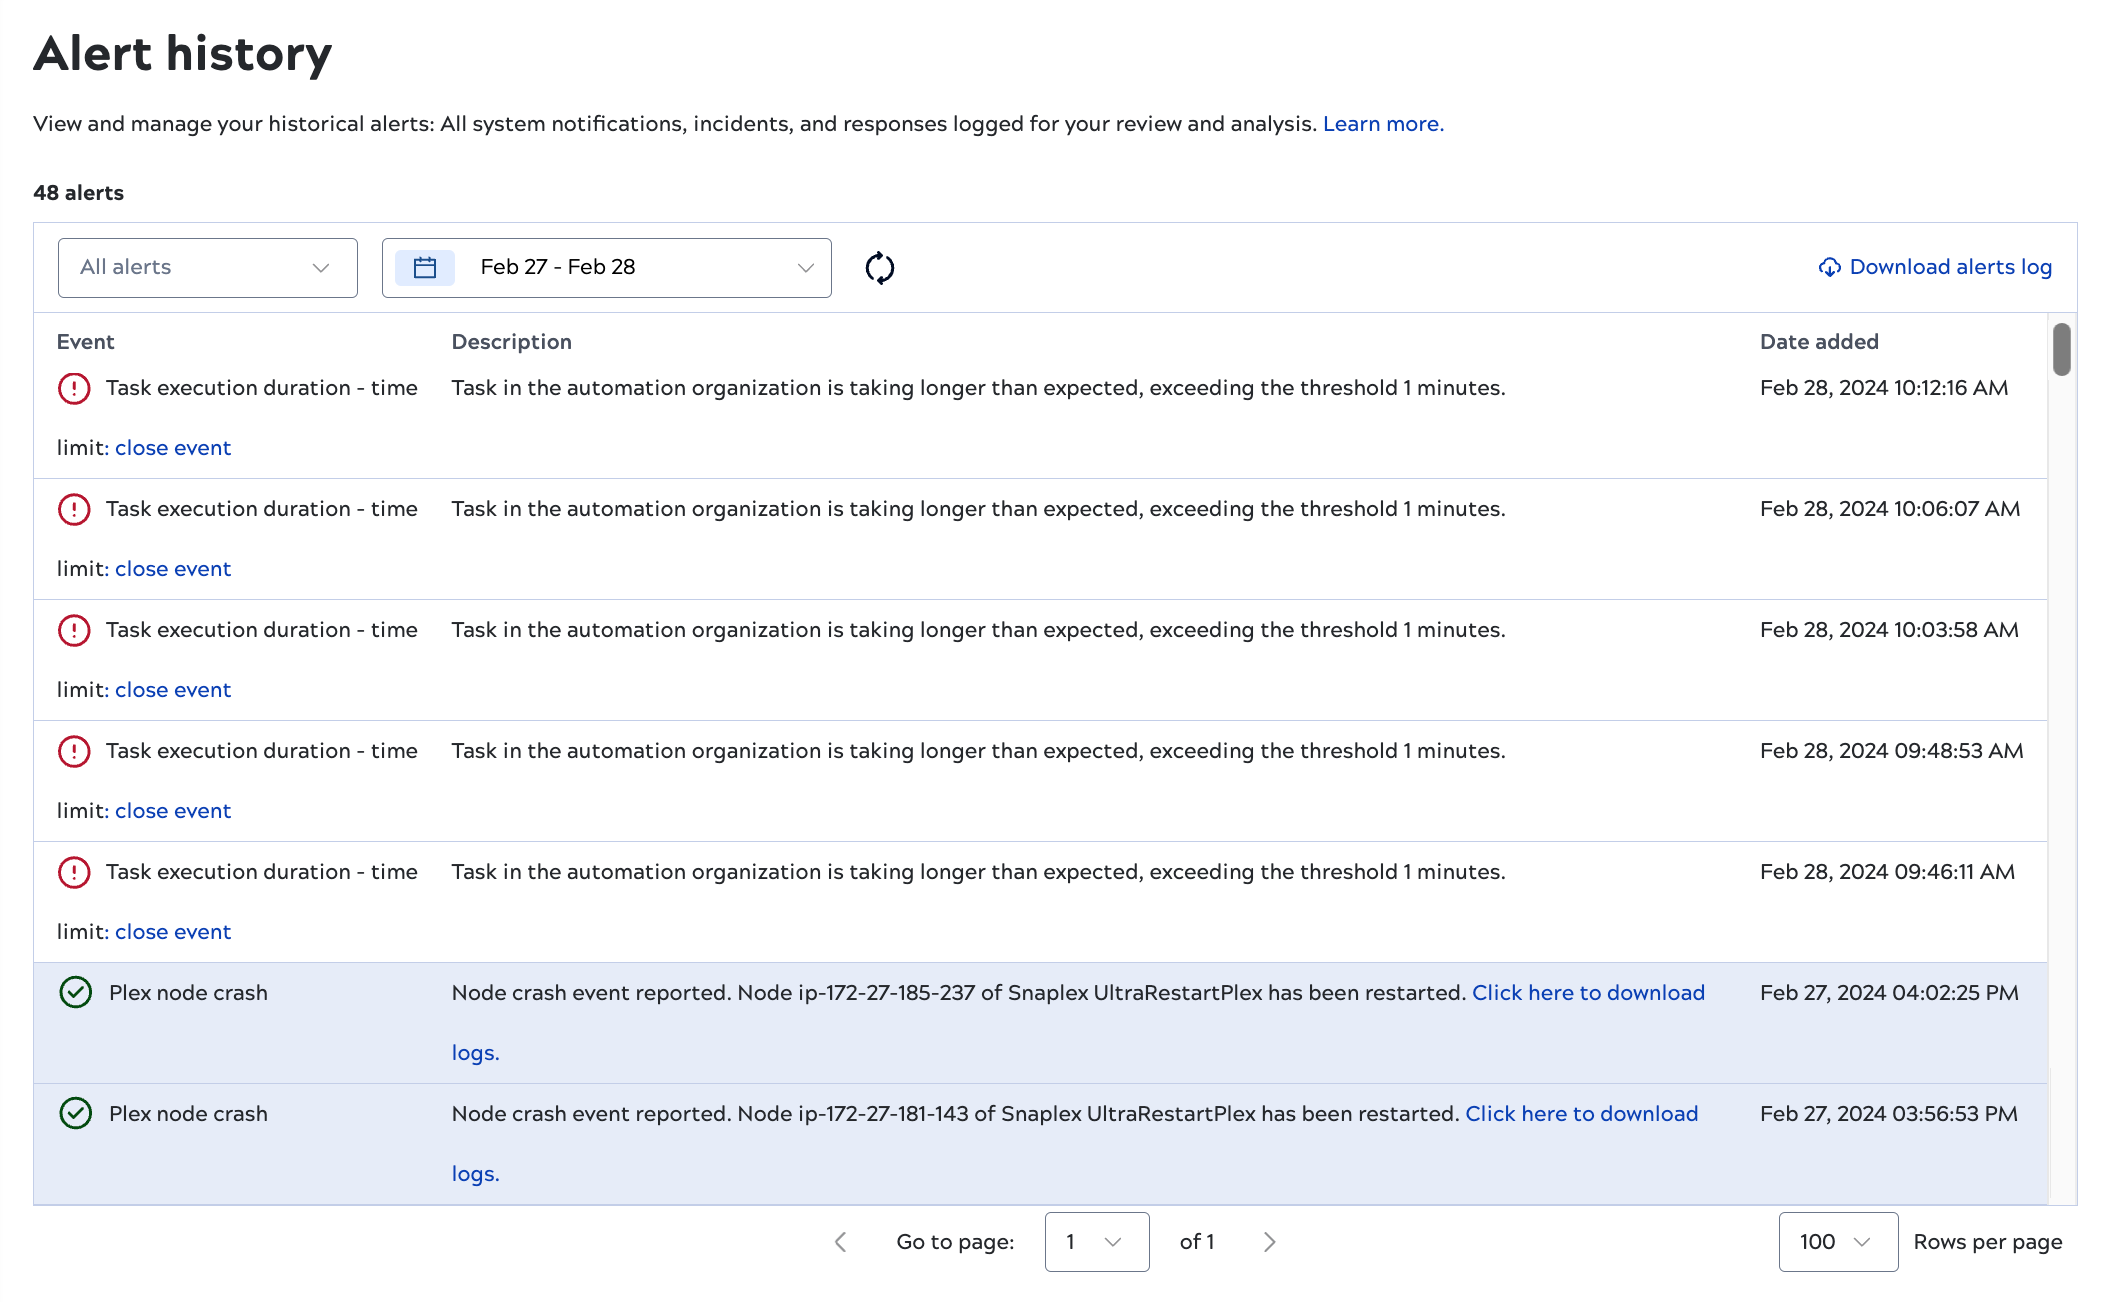
Use controls on this page to:
- Filter alerts by status: All, Open, or Closed. Alerts are open until you close them.
- Select the report date range.
- Download the log of alerts in CSV file format. The log includes the alerts for the selected date range and status.
- Close alerts that you've addressed.
Snaplex nodes raise alerts for problems during initialization. You can address these alerts for self-managed Snaplexes (Groundplexes). SnapLogic manages issues with Cloudplexes.
You can also configure notifications for a variety of Snaplex-related events. These show up in the Activity log. Learn more about informational and operational Platform notifications.