Monitor
Use SnapLogic Monitor to observe activities and events, monitor health, and troubleshoot issues in your SnapLogic environment. Pages include:
- Integrations catalog—Metadata for pipelines and their associated tasks (Beta for Enterprise customers on request)
- Insights—A summary of users, pipelines, documents processed, and more
- Execution overview—Records of executed and executing pipelines, including errors and logs
- Infrastructure—Resource use for Snaplexes and their nodes
- Metrics—Charts of resource use for a Snaplex node
- Activity logs—System notifications and events
- Alert history—Snaplex node alerts
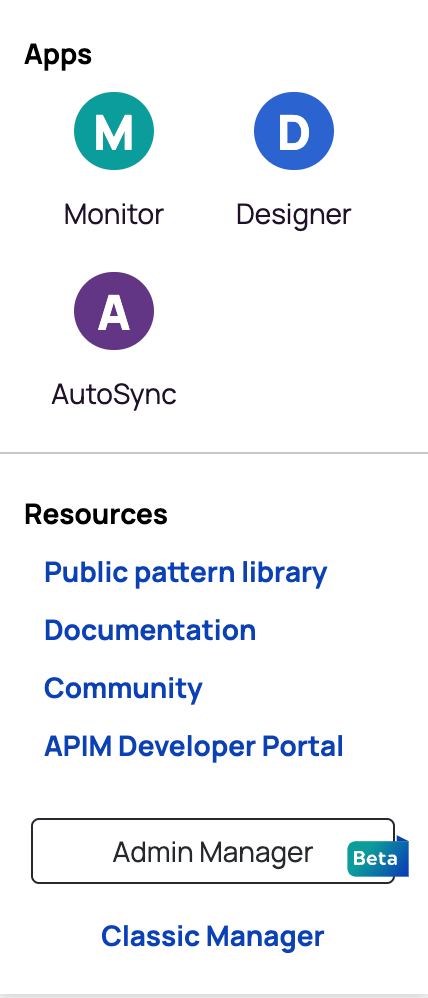
Open Monitor from the Apps menu on the right side of the header:
Learn more about how to use Monitor to:
Monitor also displays informational, operational, and alert messages. Learn more about these different types of Platform notifications.